Trade
Basic
Futures
Futures
Hundreds of contracts settled in USDT or BTC
Options
HOT
Trade European-style vanilla options
Unified Account
Maximize your capital efficiency
Demo Trading
Futures Kickoff
Get prepared for your futures trading
Futures Events
Participate in events to win generous rewards
Demo Trading
Use virtual funds to experience risk-free trading
Earn
Launch
CandyDrop
Collect candies to earn airdrops
Launchpool
Quick staking, earn potential new tokens
HODLer Airdrop
Hold GT and get massive airdrops for free
Launchpad
Be early to the next big token project
Alpha Points
NEW
Trade on-chain assets and enjoy airdrop rewards!
Futures Points
NEW
Earn futures points and claim airdrop rewards
Investment
Simple Earn
Earn interests with idle tokens
Auto-Invest
Auto-invest on a regular basis
Dual Investment
Buy low and sell high to take profits from price fluctuations
Soft Staking
Earn rewards with flexible staking
Crypto Loan
0 Fees
Pledge one crypto to borrow another
Lending Center
One-stop lending hub
VIP Wealth Hub
Customized wealth management empowers your assets growth
Private Wealth Management
Customized asset management to grow your digital assets
Quant Fund
Top asset management team helps you profit without hassle
Staking
Stake cryptos to earn in PoS products
Smart Leverage
NEW
No forced liquidation before maturity, worry-free leveraged gains
GUSD Minting
Use USDT/USDC to mint GUSD for treasury-level yields
More
UnlimitedStrategy
No content yet
UnlimitedStrategy
 $0
$0
$RIVER RIVER move looks strong, but also a bit scary now.
After that deep dip, the bounce was fast. Too fast, actually. Buyers stepped in hard, but price is already back near the recent top. That usually brings hesitation.
I’m not saying it will dump. It can still push a bit higher. But chasing here doesn’t feel comfortable to me. Risk feels heavier than reward at this point.
If price cools down and holds, then continuation makes sense. If not, a pullback wouldn’t surprise me at all.
Right now, I prefer watching instead of reacting.
Just my personal view.#SpotGoldHitsaNewHigh
- Reward
- like
- Comment
- Repost
- Share
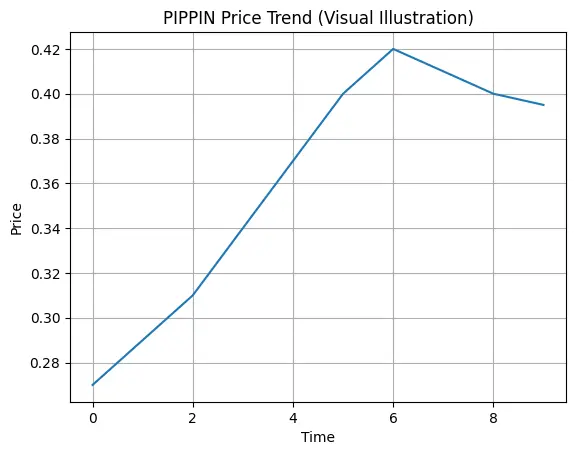
$PIPPIN Price has moved up strongly from the 0.27 zone and recently tested around 0.42, showing solid momentum. After that push, the market is now cooling down and moving sideways, which is healthy after a fast rise.
What the chart is saying 👇
Short-term trend is still bullish, price is holding above key moving averages
Volume is lower than the breakout phase → no panic selling
Momentum indicators are slowing, suggesting consolidation, not reversal
🔍 Future Outlook (Different Timeframes)
Short term (15m–1h):
Price may range between 0.38 – 0.41 while the market decides the next move.
Mid te
PIPPIN-1,9%
- Reward
- 3
- 2
- Repost
- Share
ndrettあ:
very good information to readView More
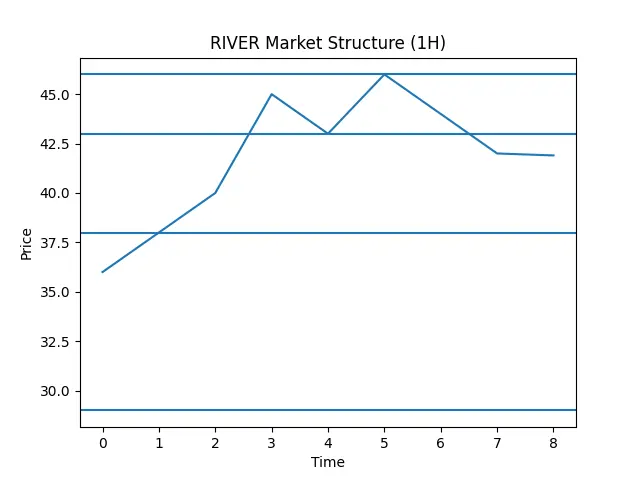
$RIVER RIVER Market Snapshot 🌊
RIVER is showing strong recovery after a sharp shakeout. Price bounced hard from the lower zone and is now trading above short-term averages, which tells me buyers are stepping back in with confidence.
What the chart says (simple view):
Short-term trend: Bullish
Price is holding above recent support
Momentum picked up after the deep pullback
Volume spike confirms real participation, not fake move
Short-term outlook (15m–1H):
If price stays above the current support area, a push toward the recent high zone is very possible. Small pullbacks here look more like b
- Reward
- like
- Comment
- Repost
- Share
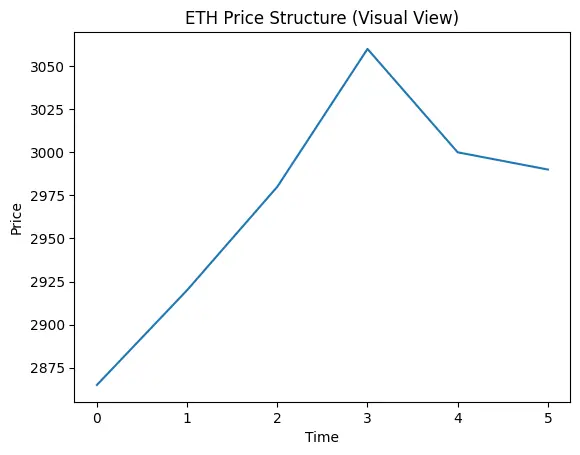
$ETH ETH is currently moving in a tight range, showing signs of consolidation after a strong bounce from the recent low. Price tried to push higher but faced resistance near the upper zone, which slowed momentum for now.
On the 1H timeframe, price is hovering around short-term moving averages. This usually means the market is deciding its next direction, not rushing.
What the chart is saying (multi-view):
• Short-term (15m–1H):
Momentum looks neutral. Buyers are active, but not aggressive yet. Sideways movement is healthy after a bounce.
• Mid-term (4H):
Structure is still holding above the
ETH-1,91%
- Reward
- 1
- 1
- Repost
- Share
ybaser :
:
2026 GOGOGO 👊$RIVER RIVER recently showed strong volatility after a sharp drop, followed by a quick recovery. On the 1H timeframe, price is now trying to stabilize after shaking out weak hands. This kind of move often decides the next short-term direction.
🔍 What the chart is saying
Price reacted strongly from the lower support zone, showing buyers are still active.
Short-term moving averages are slightly bearish, but momentum loss is slowing.
Volatility expanded (wide range), which usually comes before a directional move.
Momentum indicators suggest selling pressure is weakening, not accelerating.
⏳ Mu

- Reward
- 1
- 1
- Repost
- Share
ybaser:
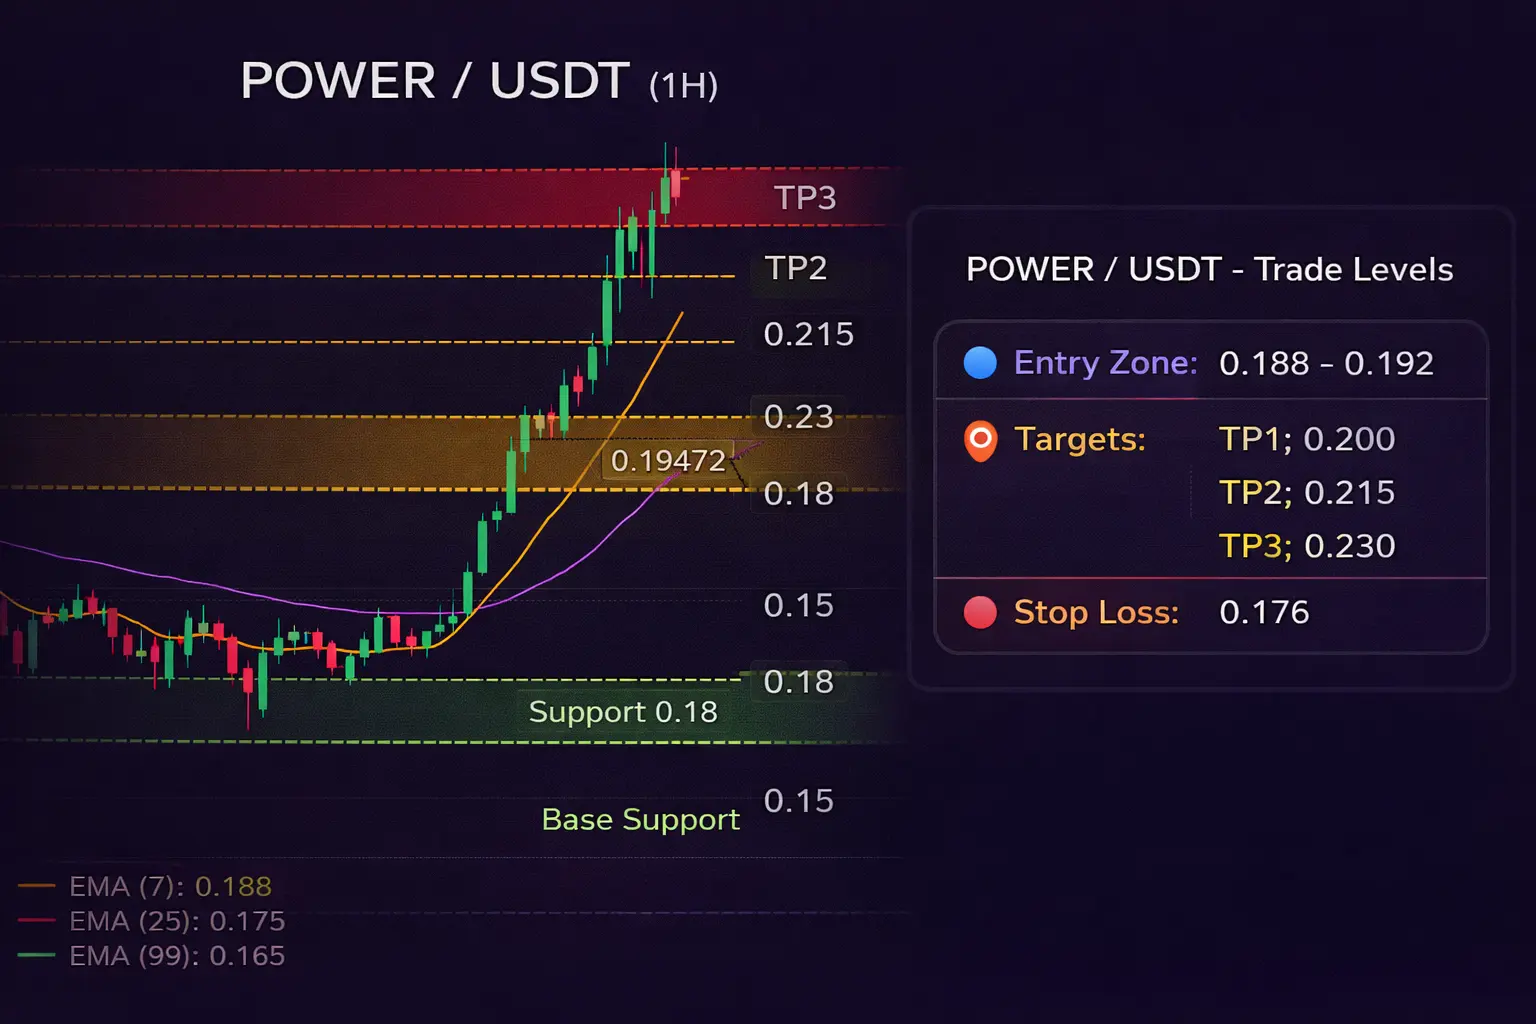
2026 GOGOGO 👊$POWER POWER — Short-Term Trade Setup (1H View)
Bias: Bullish continuation (trend already flipped up)
Entry (Buy on pullback):
• 0.188 – 0.192
Targets:
• TP1: 0.200
• TP2: 0.215
• TP3: 0.230
Stop Loss:
• 0.176
Why this setup
POWER broke out strongly from the 0.15 base and is now holding above all short-term EMAs.
Momentum and volume expansion confirm buyers are in control.
As long as price holds above 0.18, dips are likely to be bought.
A clean break and hold above 0.20 can open the door for continuation toward higher targets.
This is a personal market view, not financial advice.
POWER0,45%
- Reward
- like
- Comment
- Repost
- Share
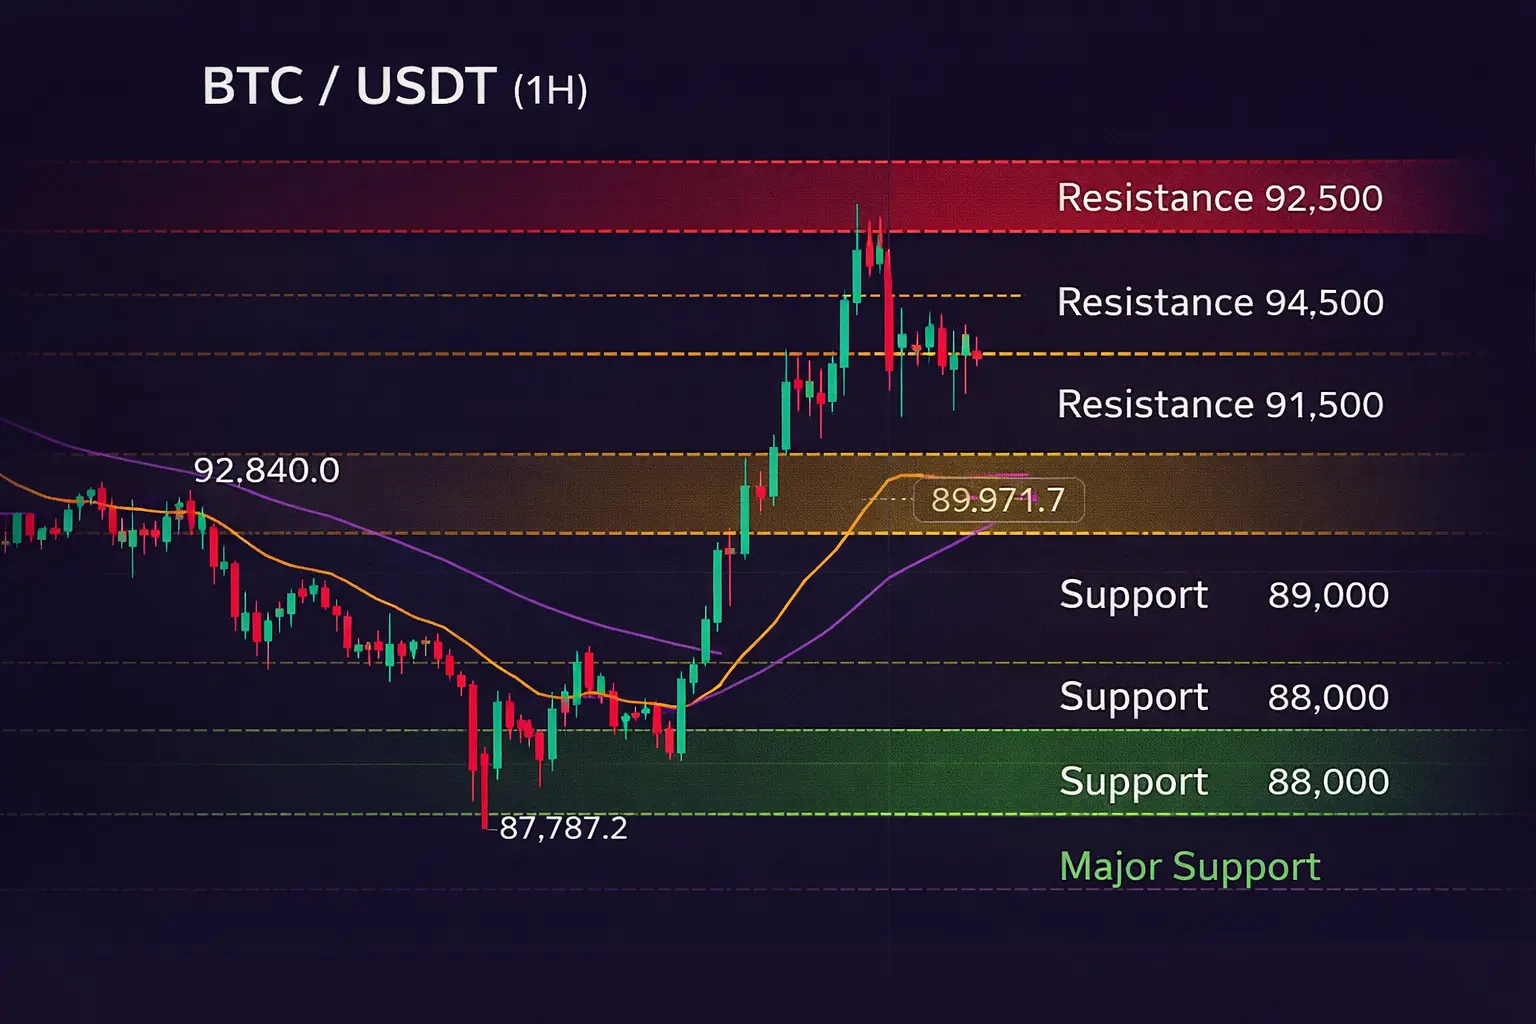
$BTC BTC — Short-Term Trade Setup (1H View)
Bias: Short-term bounce, but overall structure still weak.
Entry (Buy on pullback):
• 89,200 – 89,500
Targets:
• TP1: 90,300
• TP2: 91,200
• TP3: 92,000
Stop Loss:
• 88,600
Why this setup
Price reacted from the recent low near 87.8K and showed a relief bounce.
Momentum is improving on lower timeframes, but price is still trading below major resistance zones.
This makes the move corrective, not a full trend reversal yet.
As long as BTC holds above 88.6K, upside continuation toward the 90K–92K zone remains possible.
A clean break below support would
BTC-1,19%
- Reward
- like
- Comment
- Repost
- Share
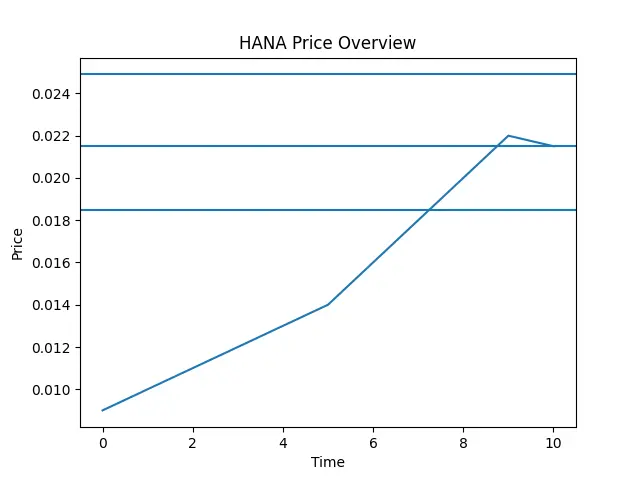
$HANA HANA is cooling after a strong push.
Price moved fast from the lower zone and is now taking a short break. This kind of pause is normal after a sharp move.
On the short timeframe, price is holding above a key support, which shows buyers are still active.
On the higher timeframe, the trend structure is still bullish as long as support stays intact.
Volume expanded during the move up, and now it’s slightly calmer — this usually means the market is deciding the next direction.
🔍 Levels That Matter
Support zone: around 0.0185
Current zone: around 0.0215
Resistance zone: near 0.0249
If pri
HANA2,3%


- Reward
- like
- Comment
- Repost
- Share
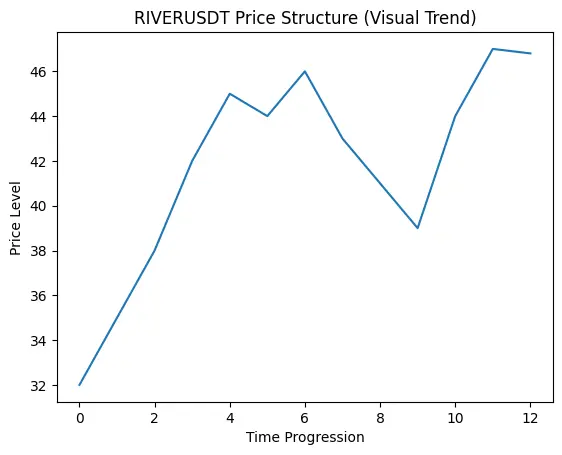
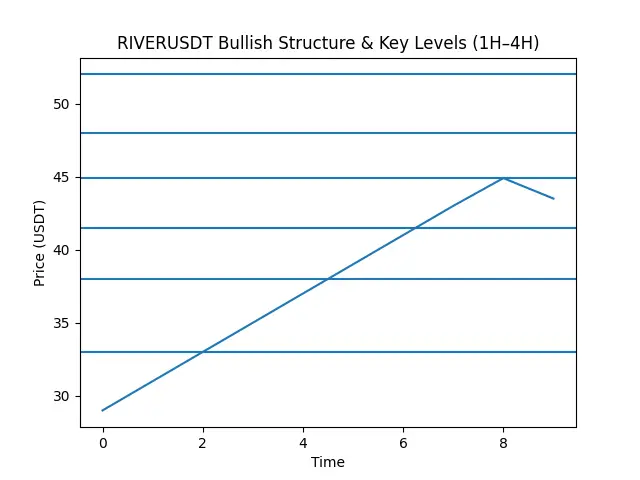
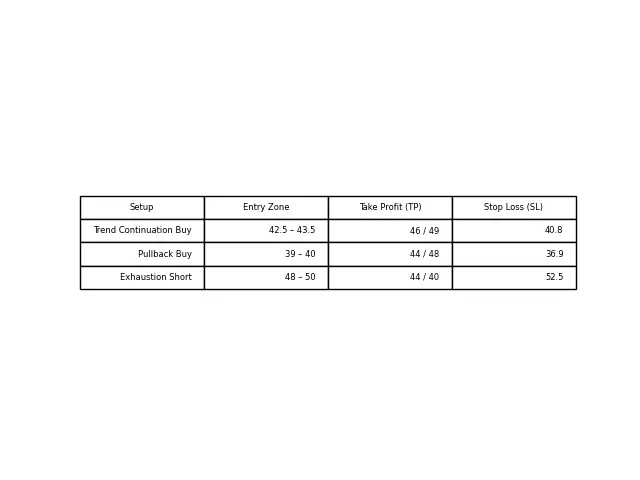
$RIVER RIVER is showing strong trend strength after a powerful breakout. Price is making higher highs and higher lows, which keeps the structure bullish for now.
On the 1H timeframe, price is holding above short and mid EMAs — buyers are still in control.
On the 4H view, this move looks like a trend expansion, not a fake pump.
A small pullback here would be healthy, not bearish.
🔑 Key Zones
Support: 41.5 → 38 → 33
Resistance: 44.9 → 48 → 52
Above support = bullish bias remains
🔮 What to Watch Next
Holding above support → continuation toward higher levels
Sharp rejection from resistance → s
- Reward
- 2
- 1
- Repost
- Share
ybaser:
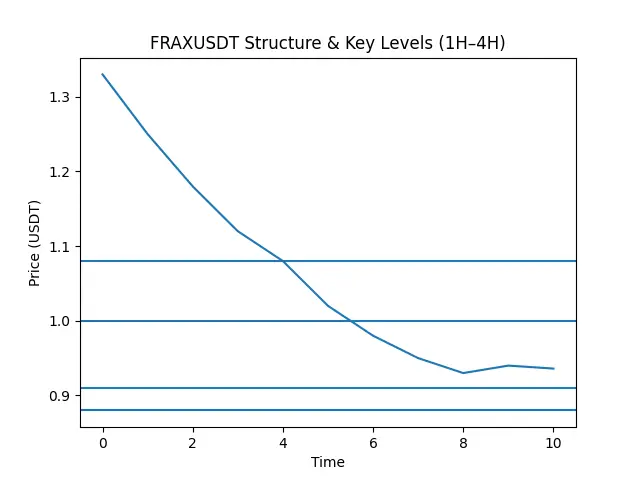
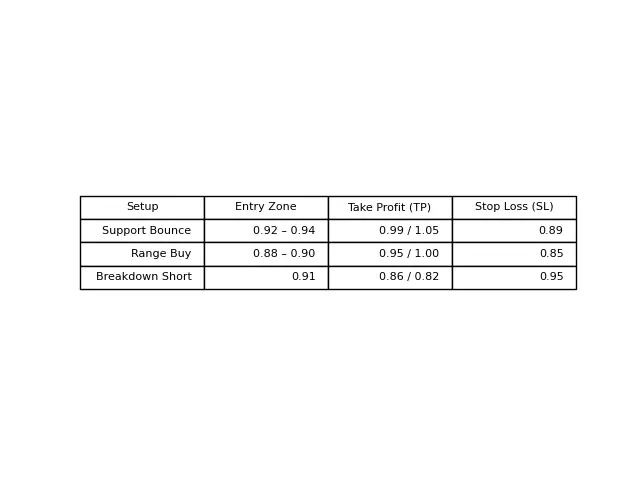
2026 GOGOGO 👊$FRAX FRAX saw a strong sell-off and is now trying to stabilize near a key support zone. Momentum is still weak, but selling pressure is cooling down, which usually comes before a range or short bounce.
On the 1H timeframe, price is trading below major EMAs — trend is still bearish.
On the 4H view, this looks more like distribution → drop → base building.
🔑 Key Levels
Support: 0.92 → 0.88
Resistance: 1.00 → 1.08
Market is currently at a decision point
🔮 What to Expect Next
Holding above support → short relief bounce possible
Losing support → continuation to lower liquidity zones
Expect sid
FRAX3,4%
- Reward
- 1
- 1
- Repost
- Share
CryptoVortex:
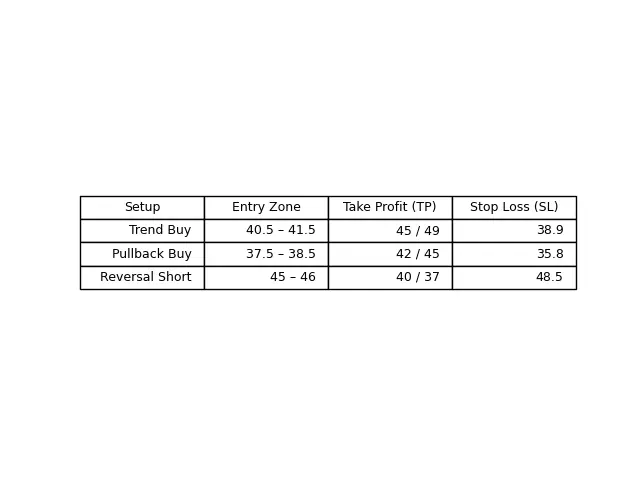
Buy To Earn 💎$RIVER RIVER made a strong upside move, followed by a healthy pullback. This doesn’t look like weakness — it looks like profit booking after a fast rally.
On the 1H timeframe, price is still holding above key moving averages, which keeps the short-term trend bullish.
On the 4H view, structure is clearly higher highs & higher lows. As long as price stays above the main demand zone, bulls remain in control.
🔑 Key Zones
Support: 38 → 35 → 32
Resistance: 45.7 → 50
Current price is sitting in a decision zone
🔮 What can happen next?
Holding above support → continuation toward higher levels
Losin
- Reward
- like
- Comment
- Repost
- Share
$BTC Price saw a sharp drop and then a clear bounce from the lower zone. That bounce tells me buyers are still active, but the structure is not bullish yet.
On the 1H timeframe, price is trying to stabilize after a strong sell-off. Momentum is cooling down, not reversing strongly.
On the 4H view, this looks like a pullback inside a bigger range, not a panic move.
Key zones to watch:
Strong demand around 88k area
Major supply sitting near 95k–98k
Market is likely to range first, then decide direction
🔮 Future Expectation
If price holds above support, a slow recovery toward resistance is poss
BTC-1,19%
- Reward
- 2
- 3
- Repost
- Share
AYATTAC:
Buy To Earn 💎View More
$AIA AIA made a sharp impulsive move after a long base, followed by a deep pullback from the top.
Right now, price is stabilizing around the 0.29–0.30 zone, which is acting as a short-term decision area.
On the 1H timeframe, momentum has cooled down after the spike, but structure is still holding above the major breakout base.
Higher timeframes suggest this move was expansion, and the current phase looks more like consolidation, not full weakness.
If price continues to hold above support, a gradual recovery toward previous resistance levels remains possible.
A breakdown below key support wou
AIA-12,35%

- Reward
- like
- Comment
- Repost
- Share
$AIA AIA made a sharp impulsive move after a long base, followed by a deep pullback from the top.
Right now, price is stabilizing around the 0.29–0.30 zone, which is acting as a short-term decision area.
On the 1H timeframe, momentum has cooled down after the spike, but structure is still holding above the major breakout base.
Higher timeframes suggest this move was expansion, and the current phase looks more like consolidation, not full weakness.
If price continues to hold above support, a gradual recovery toward previous resistance levels remains possible.
A breakdown below key support wou
Right now, price is stabilizing around the 0.29–0.30 zone, which is acting as a short-term decision area.
On the 1H timeframe, momentum has cooled down after the spike, but structure is still holding above the major breakout base.
Higher timeframes suggest this move was expansion, and the current phase looks more like consolidation, not full weakness.
If price continues to hold above support, a gradual recovery toward previous resistance levels remains possible.
A breakdown below key support wou
AIA-12,35%
- Reward
- like
- Comment
- Repost
- Share
$AIA Trade Idea: LONG (pullback based)
Entry: 0.345 – 0.360
Stop Loss: 0.298
Take Profit:
TP1: 0.385
TP2: 0.420
TP3: 0.480
Why this setup works:
Price made a vertical breakout with high volume
EMA stack is fully bullish (price above all EMAs)
Previous resistance around 0.34–0.36 now acting as support
As long as AIA holds above 0.30, structure remains bullish
⚠️ After such a strong pump, pullbacks are normal. Best entries come on dips, not on green candles.
AIA-12,35%

- Reward
- 1
- Comment
- Repost
- Share
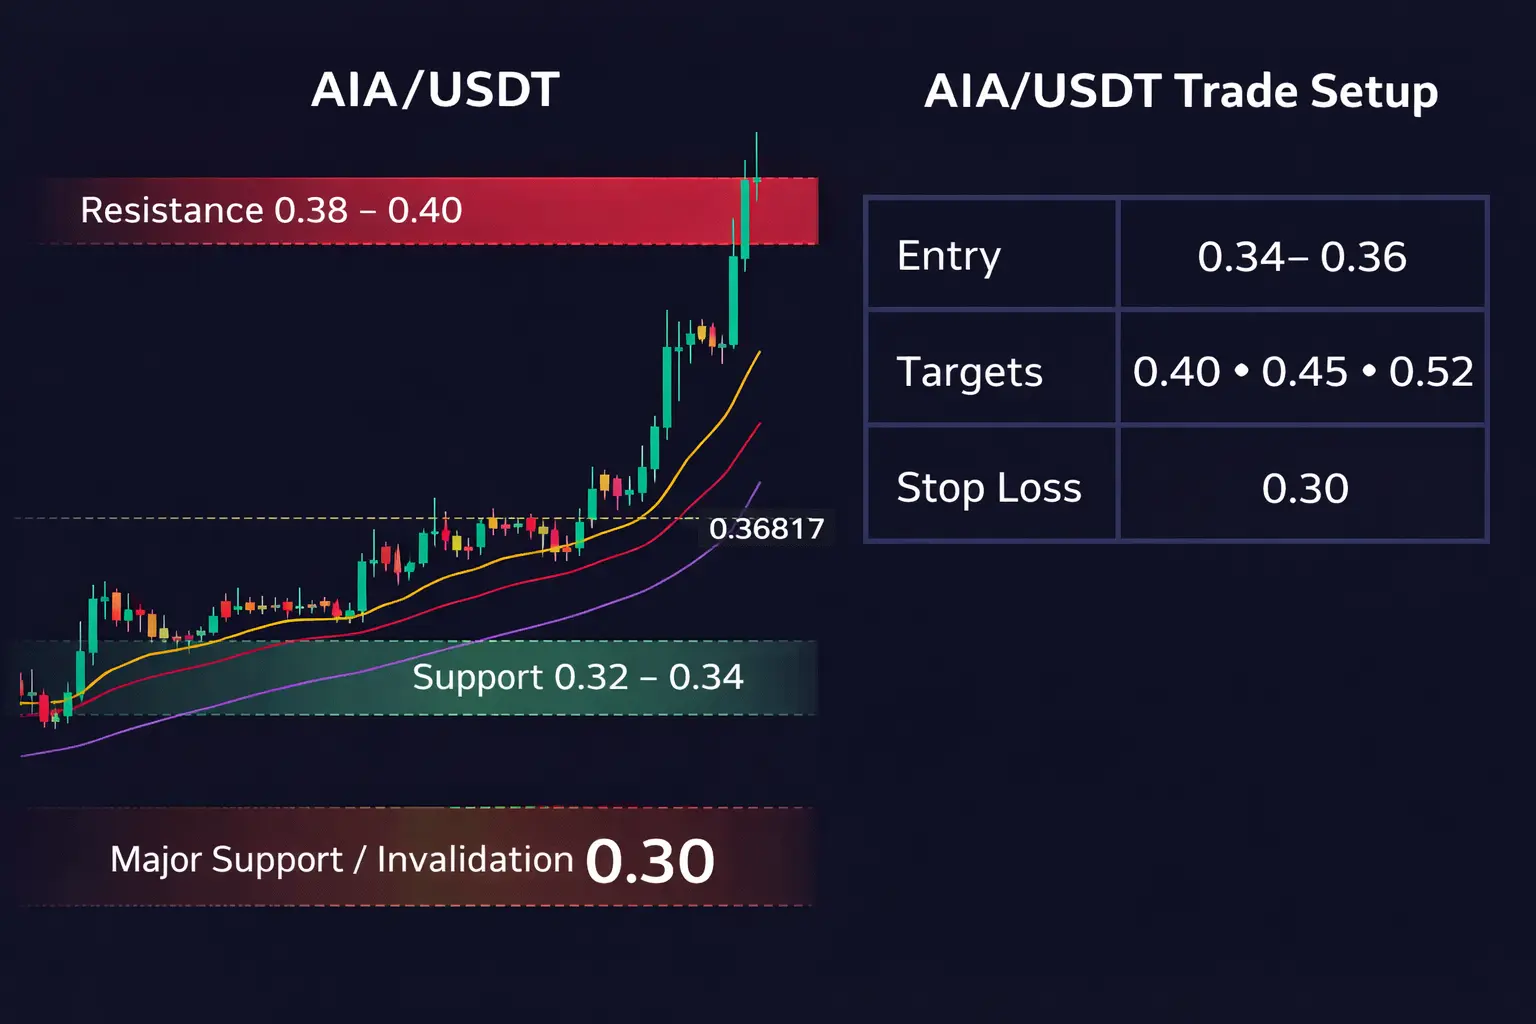
$AIA AIA just delivered a strong vertical move after breaking out from a long consolidation base. Momentum is aggressive, volume expansion confirms participation, and price is now trading well above all key EMAs.
This is a high-volatility phase, so patience and level-based execution matter.
Trade Plan (Pullback-Based Long)
Entry: 0.34 – 0.36
Targets: 0.40 → 0.45 → 0.52
Stop Loss: 0.30
Technical View
Strong impulse candle indicates breakout + momentum ignition
EMA alignment is fully bullish (price far above EMA 7 / 25 / 99)
0.30–0.32 is the first demand zone to watch on pullbacks
Above 0.38,
AIA-12,35%
Subscribing
0 / $50000
0%
0D
:
00
:
00
:
00
- Reward
- 2
- 1
- Repost
- Share
ybaser:
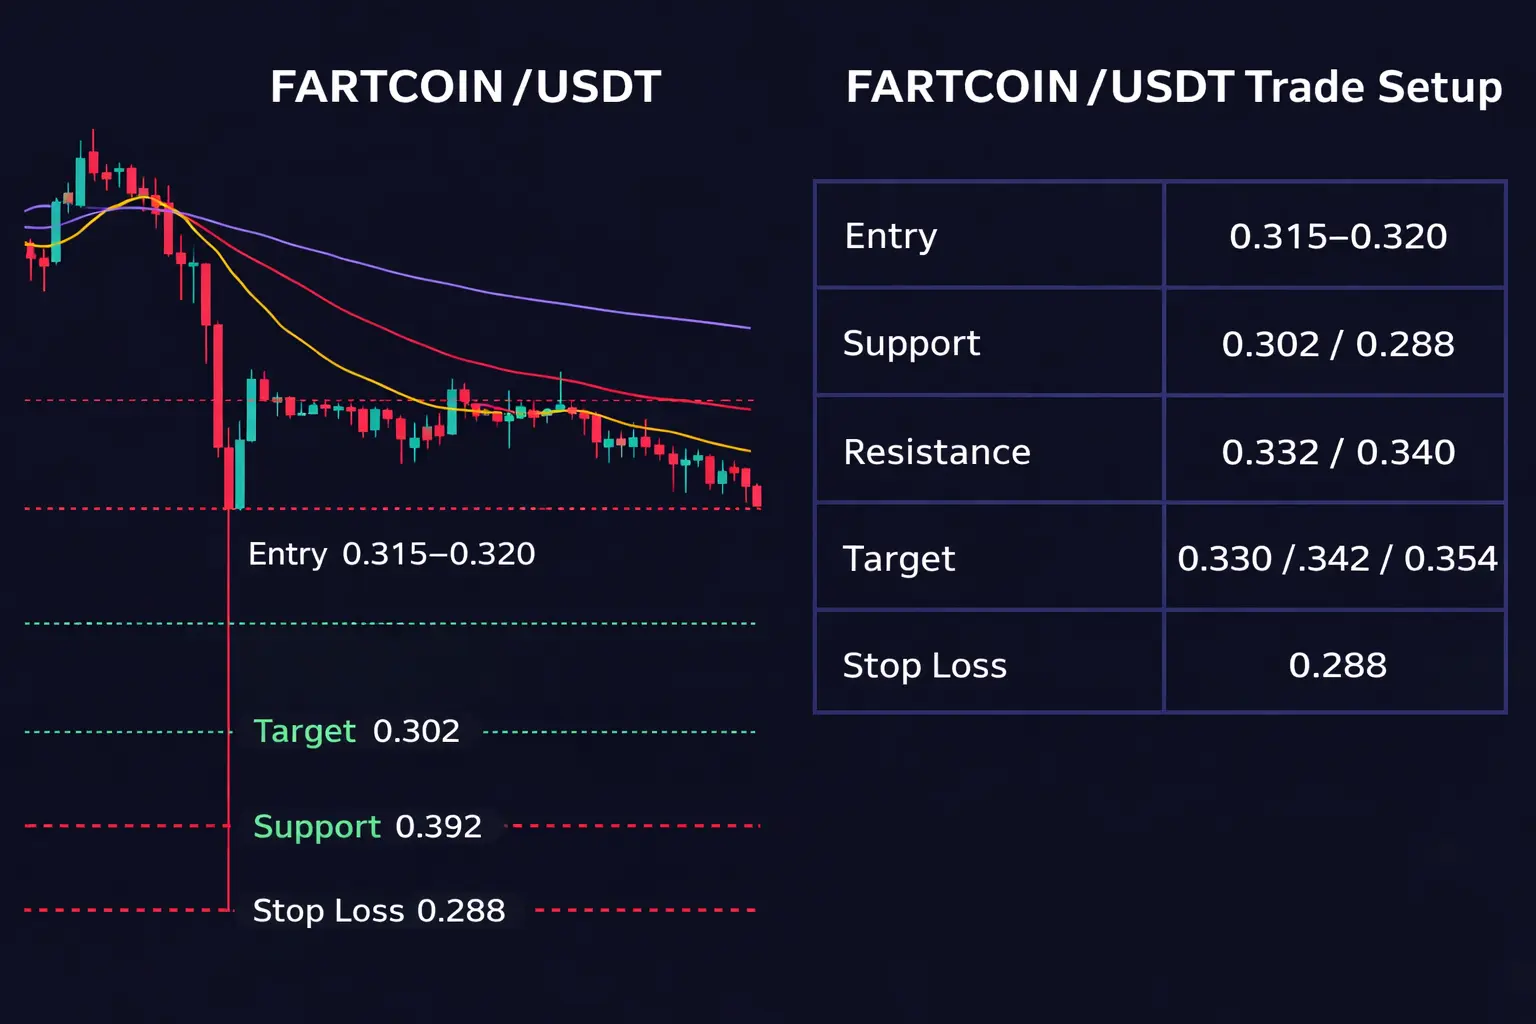
2026 GOGOGO 👊$FARTCOIN $FARTCOIN — Sellers Still in Control 📉
FARTCOIN continues to trade under pressure after failing to reclaim key short-term EMAs. Price is grinding lower with weak bounce attempts, suggesting sellers are still dominating the structure.
Trade Setup (Short Bias)
Entry: 0.305 – 0.315
Targets: 0.295 → 0.285 → 0.272
Stop Loss: 0.332
Technical Breakdown
Price remains below EMA 25 & EMA 99, keeping momentum bearish
0.317 – 0.320 acts as a strong intraday resistance zone
0.300 is the first key support; a clean break opens room toward lower liquidity
Market structure shows lower highs and lo
FARTCOIN-1,74%
Subscribing
0 / $50000
0%
0D
:
00
:
00
:
00
- Reward
- 1
- Comment
- Repost
- Share
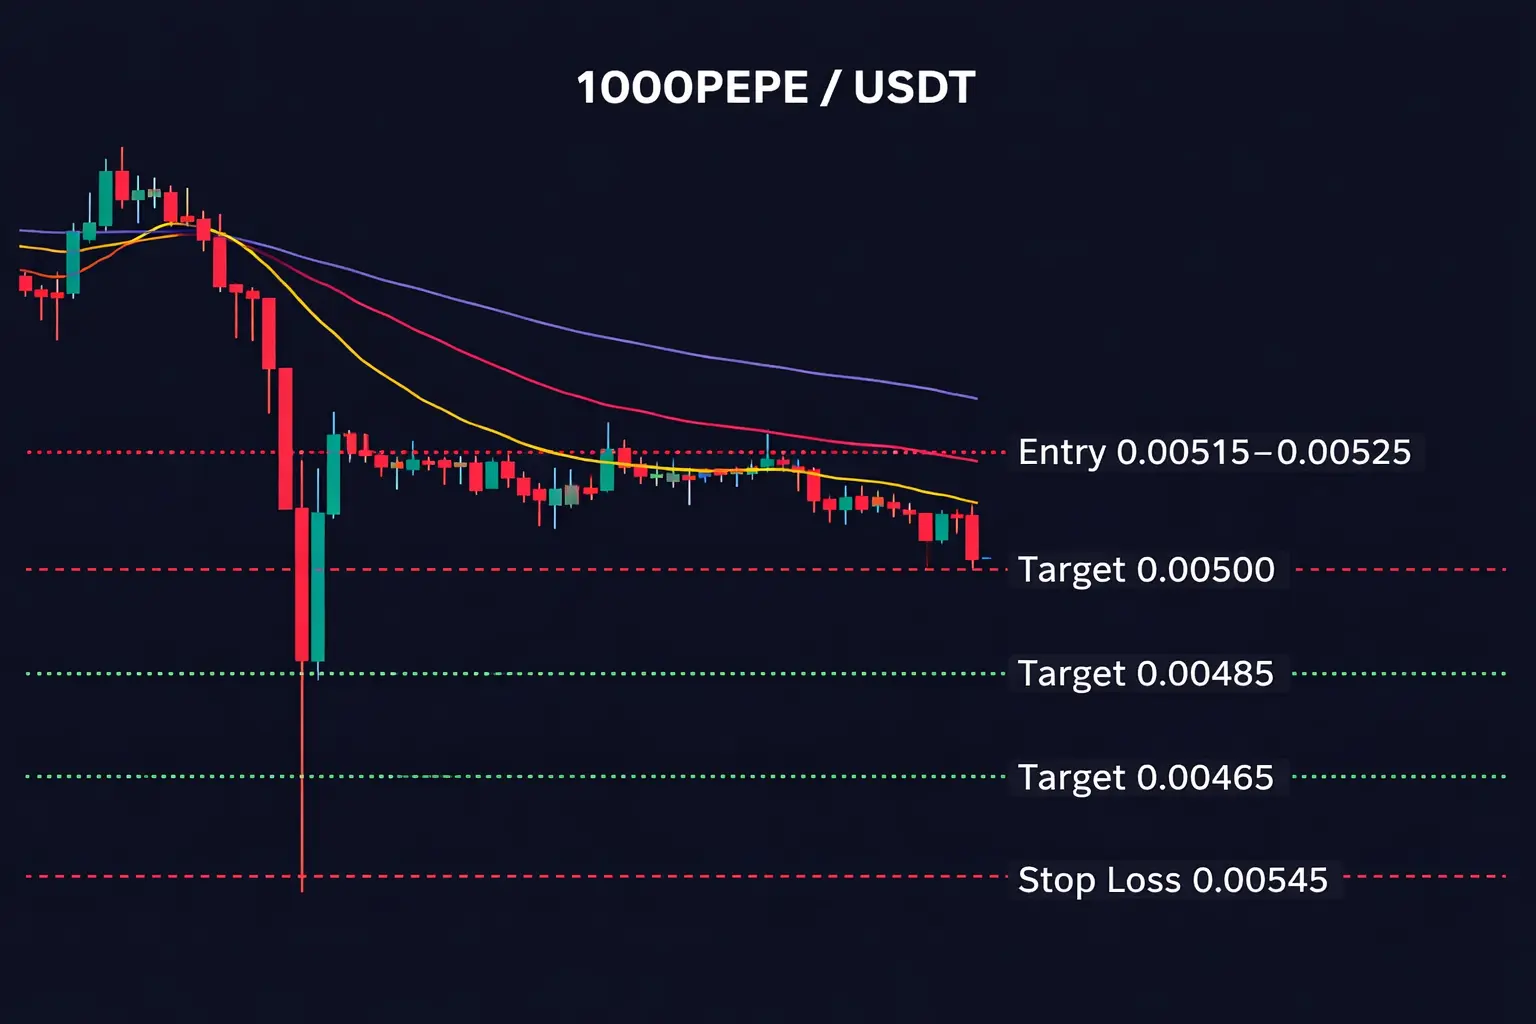
$PEPE 1000PEPE remains under pressure after a sharp breakdown, with price trading below all key short-term EMAs. The structure is weak and rallies are being sold, keeping the short-term bias bearish.
Momentum indicators show limited buying strength, and price is struggling to reclaim the mid-range, which suggests sellers are still in control.
Trade Plan (Short Bias)
Entry: 0.00515 – 0.00525
Targets: 0.00500 → 0.00485 → 0.00465
Stop Loss: 0.00545
Technical Context
Price is holding below EMA(25) and EMA(99)
Market structure shows lower highs and lower lows
Any bounce into resistance is likely
PEPE-4,54%
Subscribing
0 / $50000
0%
0D
:
00
:
00
:
00
- Reward
- 2
- 1
- Repost
- Share
ybaser:
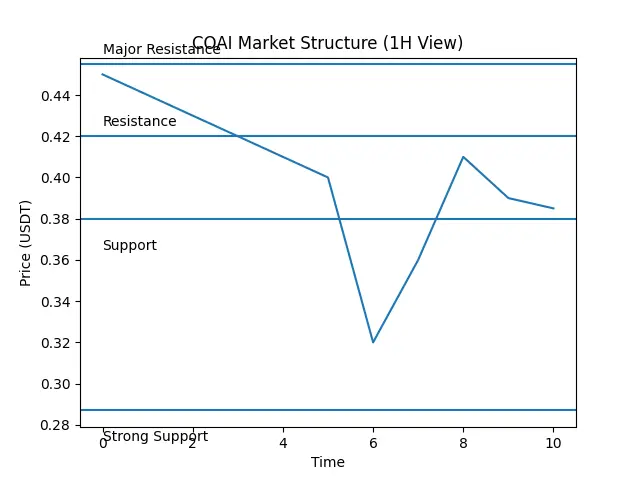
2026 GOGOGO 👊$COAI COAI faced a sharp sell-off earlier, followed by a fast bounce. That kind of move usually shows panic selling first, then dip buyers stepping in. After the bounce, price is cooling down and moving slowly, which means the market is deciding its next direction.
On the 1H timeframe, momentum is still weak, but heavy selling pressure has reduced. This zone often acts as a short-term stabilization area.
Multi-timeframe view
Short term (1H): Sideways to weak, trying to build a base
Mid term (4H): Recovery possible if support holds
Momentum view: Oversold signals earlier, now slowly normalizi
COAI-2,03%
Subscribing
0 / $50000
0%
0D
:
00
:
00
:
00
- Reward
- 1
- Comment
- Repost
- Share
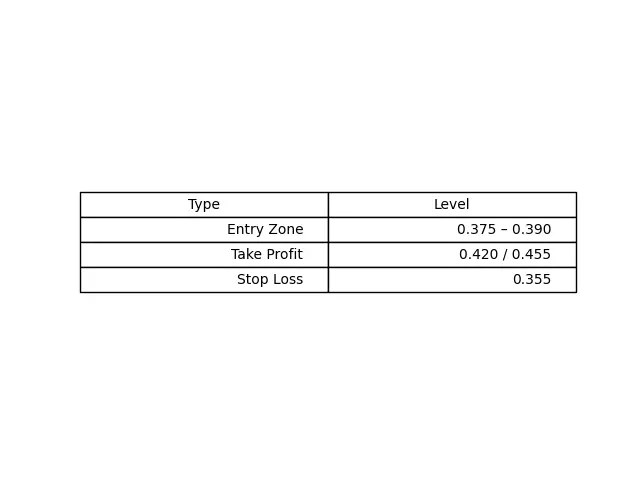
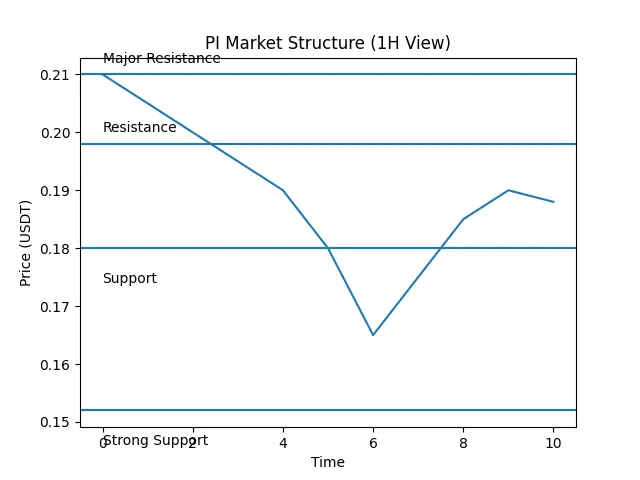
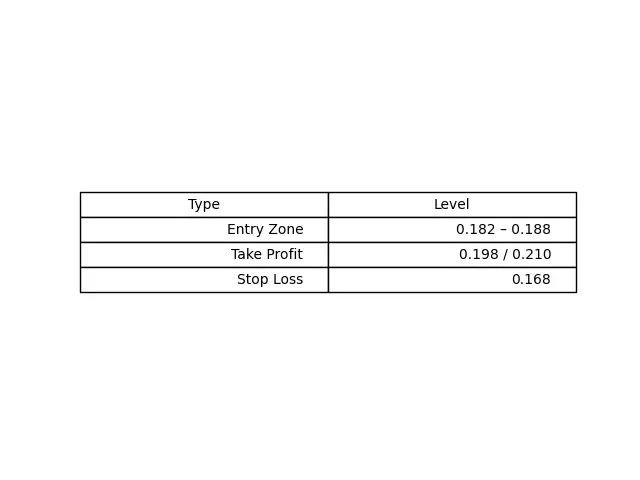
PI saw a sharp drop earlier and quickly bounced, which usually means panic selling followed by demand buying. After the bounce, price is moving sideways, showing the market is trying to stabilize.
On the 1H timeframe, momentum is still weak but selling pressure is slowing down. This often happens near a local bottom.
Multi-timeframe view
Short term (1H): Sideways movement after a strong drop
Mid term (4H): Recovery possible if support holds
Indicators: RSI is near oversold zone, suggesting limited downside from here
What to watch
Holding above support can lead to a slow move toward resistance
PI0,78%
Subscribing
0 / $50000
0%
0D
:
00
:
00
:
00
- Reward
- like
- Comment
- Repost
- Share
Trending Topics
View More57.02K Popularity
36.89K Popularity
21.47K Popularity
66.43K Popularity
347.27K Popularity
Pin