Trade
Basic
Futures
Futures
Hundreds of contracts settled in USDT or BTC
Options
HOT
Trade European-style vanilla options
Unified Account
Maximize your capital efficiency
Demo Trading
Futures Kickoff
Get prepared for your futures trading
Futures Events
Participate in events to win generous rewards
Demo Trading
Use virtual funds to experience risk-free trading
Earn
Launch
CandyDrop
Collect candies to earn airdrops
Launchpool
Quick staking, earn potential new tokens
HODLer Airdrop
Hold GT and get massive airdrops for free
Launchpad
Be early to the next big token project
Alpha Points
NEW
Trade on-chain assets and enjoy airdrop rewards!
Futures Points
NEW
Earn futures points and claim airdrop rewards
Investment
Simple Earn
Earn interests with idle tokens
Auto-Invest
Auto-invest on a regular basis
Dual Investment
Buy low and sell high to take profits from price fluctuations
Soft Staking
Earn rewards with flexible staking
Crypto Loan
0 Fees
Pledge one crypto to borrow another
Lending Center
One-stop lending hub
VIP Wealth Hub
Customized wealth management empowers your assets growth
Private Wealth Management
Customized asset management to grow your digital assets
Quant Fund
Top asset management team helps you profit without hassle
Staking
Stake cryptos to earn in PoS products
Smart Leverage
NEW
No forced liquidation before maturity, worry-free leveraged gains
GUSD Minting
Use USDT/USDC to mint GUSD for treasury-level yields
More
# 现货黄金再创新高
20.13K
CoinWay
Spot gold reaching new highs again has led to a return of risk aversion sentiment, but is this the start of a new trend?
Recently, the price of spot gold has once again hit a record high, attracting widespread market attention. On the surface, this appears to be a typical safe-haven move, but a deeper analysis reveals that the driving forces behind gold's rise are undergoing structural changes. It is no longer just a “temporary refuge during sudden risks,” but, under the interplay of multiple macro variables, is gradually returning to its core role as a long-term asset allocation.
First, globa
View OriginalRecently, the price of spot gold has once again hit a record high, attracting widespread market attention. On the surface, this appears to be a typical safe-haven move, but a deeper analysis reveals that the driving forces behind gold's rise are undergoing structural changes. It is no longer just a “temporary refuge during sudden risks,” but, under the interplay of multiple macro variables, is gradually returning to its core role as a long-term asset allocation.
First, globa
- Reward
- 4
- 5
- Repost
- Share
AYATTAC:
2026 GOGOGO 👊View More
Is it risky to chase after new highs in spot gold? The key depends on three variables
As spot gold repeatedly hits new highs, debates also arise: is it safe to chase the rally now? The answer isn't simple; it mainly depends on whether three core variables have changed, rather than just the price itself.
First, has the macro risk genuinely eased? If geopolitical tensions cool down and the global economic recovery becomes highly certain, then the safe-haven premium of gold may systematically decline. But from the current situation, this condition has not yet materialized.
Second, is there a reve
View OriginalAs spot gold repeatedly hits new highs, debates also arise: is it safe to chase the rally now? The answer isn't simple; it mainly depends on whether three core variables have changed, rather than just the price itself.
First, has the macro risk genuinely eased? If geopolitical tensions cool down and the global economic recovery becomes highly certain, then the safe-haven premium of gold may systematically decline. But from the current situation, this condition has not yet materialized.
Second, is there a reve
- Reward
- 7
- 6
- Repost
- Share
AYATTAC:
2026 GOGOGO 👊View More
As gold reaches new heights, the market is re-evaluating the definition of "safe assets"
Spot gold hits new highs again, which actually sends an important signal to the market: the traditional concept of "safe assets" is being redefined. In the past, the US dollar and US Treasuries were considered risk-free assets, but now this consensus is cracking, and gold is becoming the new carrier of consensus.
From a macro perspective, high debt and high deficits have become the norm, limiting monetary policy space. Even with economic slowdown, it is difficult to return to a long-term low-interest-rate
View OriginalSpot gold hits new highs again, which actually sends an important signal to the market: the traditional concept of "safe assets" is being redefined. In the past, the US dollar and US Treasuries were considered risk-free assets, but now this consensus is cracking, and gold is becoming the new carrier of consensus.
From a macro perspective, high debt and high deficits have become the norm, limiting monetary policy space. Even with economic slowdown, it is difficult to return to a long-term low-interest-rate
- Reward
- 3
- 3
- Repost
- Share
CoinWay:
2026 Go Go Go 👊View More
Gold continues to reach new highs, but what is truly rising is not the price itself, but "uncertainty."
Spot gold hits new highs again, and many investors' first reaction is "it's too expensive, I dare not chase," but the market rarely pushes an asset to a record high without reason. In fact, behind gold prices, what is truly amplified is not the metal itself, but the ongoing increase in global systemic uncertainty.
The world is currently in a phase of "old order loosening, new order not yet established." Repeated monetary policy adjustments, normalized fiscal expansion, and geopolitical fragm
View OriginalSpot gold hits new highs again, and many investors' first reaction is "it's too expensive, I dare not chase," but the market rarely pushes an asset to a record high without reason. In fact, behind gold prices, what is truly amplified is not the metal itself, but the ongoing increase in global systemic uncertainty.
The world is currently in a phase of "old order loosening, new order not yet established." Repeated monetary policy adjustments, normalized fiscal expansion, and geopolitical fragm
- Reward
- 5
- 6
- Repost
- Share
AYATTAC:
2026 GOGOGO 👊View More
What is the capital buying? Not the increase, but certainty
If you observe carefully, you'll notice that gold's upward pace isn't crazy, but steady progress. This indicates that the dominant funds are not short-term speculators but rather medium- to long-term strategic investors.
The main reasons for the current capital entering gold are threefold:
* Stability hedging in an environment of high uncertainty
* Decreased correlation with stocks and bonds
* Long-term defense against fiat currency credit risks
The characteristics of such funds are: they do not pursue the lowest point, nor do they mi
View OriginalIf you observe carefully, you'll notice that gold's upward pace isn't crazy, but steady progress. This indicates that the dominant funds are not short-term speculators but rather medium- to long-term strategic investors.
The main reasons for the current capital entering gold are threefold:
* Stability hedging in an environment of high uncertainty
* Decreased correlation with stocks and bonds
* Long-term defense against fiat currency credit risks
The characteristics of such funds are: they do not pursue the lowest point, nor do they mi
- Reward
- 4
- 3
- Repost
- Share
CoinWay:
New Year Wealth Explosion 🤑View More
#现货黄金再创新高 , in the crypto world, managing capital positions is essential. Everyone should make a plan on how to allocate their spot holdings by 2026.
View Original- Reward
- 1
- 1
- Repost
- Share
Discovery:
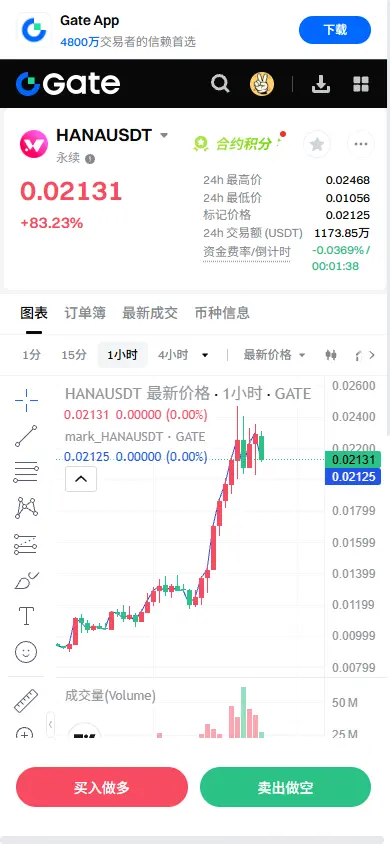
Watching Closely 🔍️【$HANA Signal】Long + Main Force Accumulation Breakthrough
$HANA After a massive surge of 81.8%, the price is currently undergoing healthy consolidation at high levels. The open interest has simultaneously surged, indicating a typical main force entry and accumulation structure, rather than mere retail FOMO. The market shows buying pressure absorbing all LTF pullbacks, with no panic selling.
🎯 Direction: Long
🎯 Entry: 0.0205 - 0.0210
🛑 Stop Loss: 0.0195 ( Rigid stop loss, invalidates the structure if broken )
🚀 Target 1: 0.0250
🚀 Target 2: 0.0300
$HANA Price-volume behavior (PA) is extr
View Original
- Reward
- 2
- 7
- Repost
- Share
4Quaranz :
:
bngView More
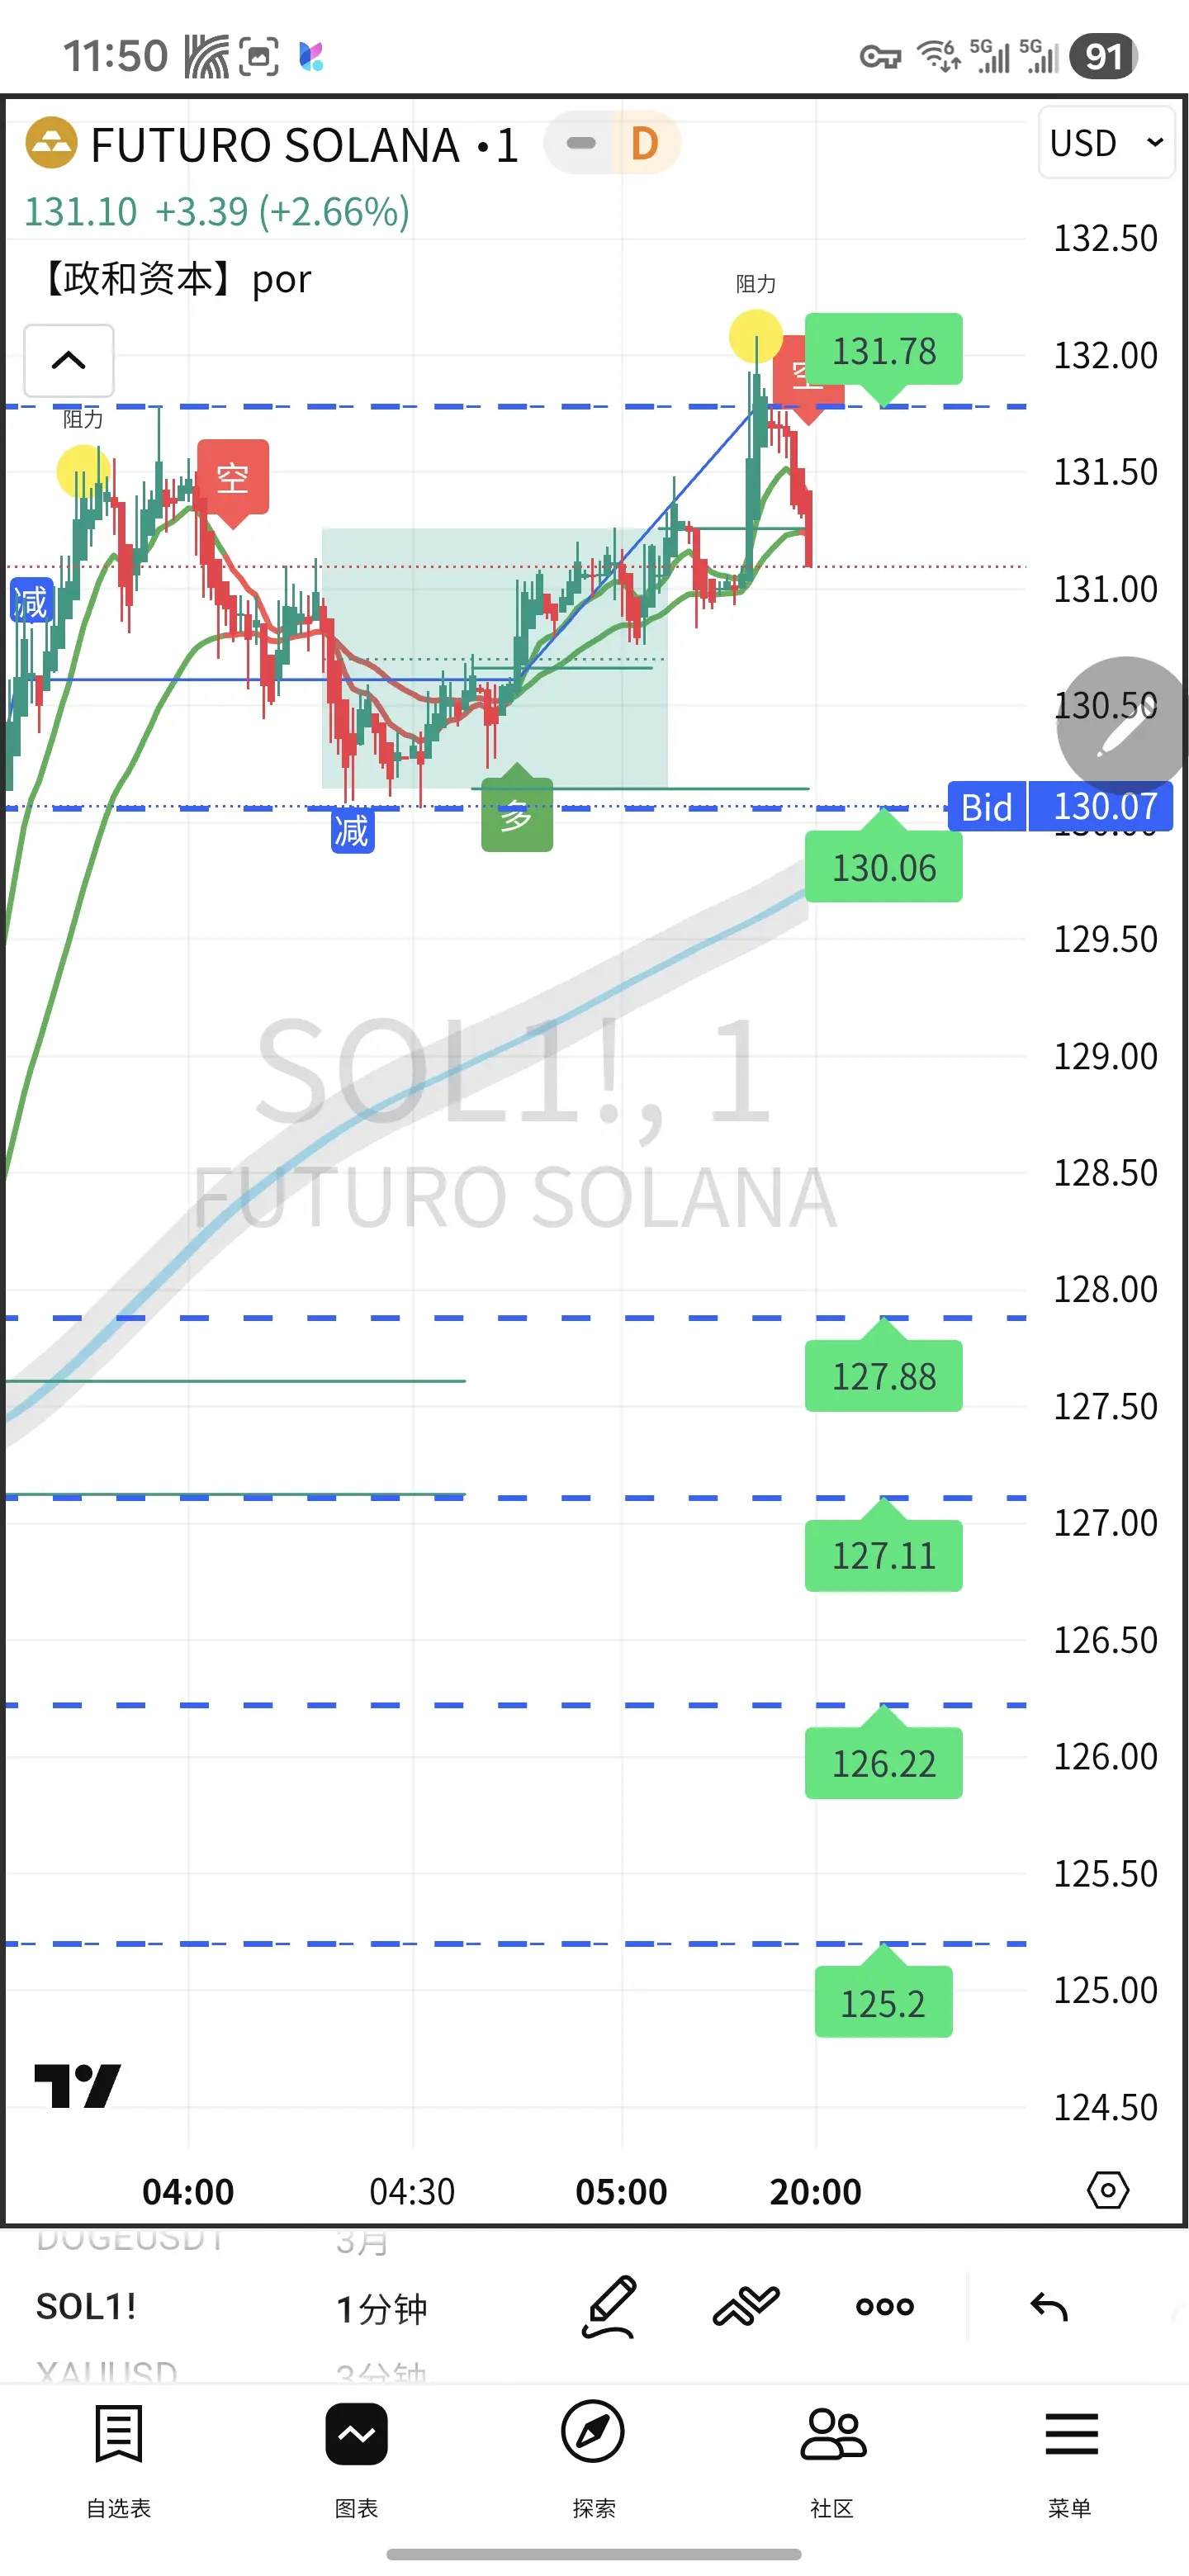
January 22 SOL Technical Overview (As of 11:50, Price approximately 128.0)
- Conclusion: Daily chart is bearish, 4H is oscillating slightly bullish. Short-term range is 126-132, wait for a breakout to determine direction, strictly control position size.
- Key levels: Support at 126, 124.5, 122; Resistance at 132, 135-137, 140.
- Strategy: Range trading with high sell and low buy, follow the trend with light positions after a breakout, avoid chasing rallies and panic selling.
Core Indicators and Patterns
- Daily: Consecutive bearish candles, price near Bollinger Band lower band, RSI<40, bears d
SOL0,86%
- Reward
- 2
- 4
- Repost
- Share
GateUser-d10f5768 :
:
Hold on tight, we're about to take off 🛫View More
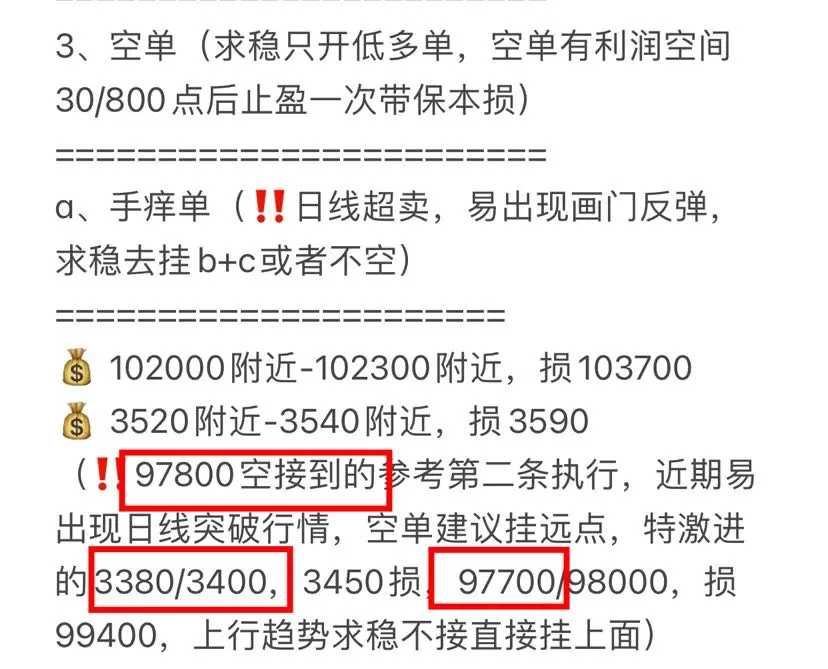
🔥 Guan He and the wheel brothers, give U‼️ Unknowingly, the subscription has entered its 3rd year, and the number of subscribers has also exceeded 150🀄️ The 4.8gt discount is about to end and will revert to 8gt. Friends who subscribe are not fools; if you're not making money, then definitely 😄. You can click 👇 or copy the link to subscribe on the web:
https://www.gate.com/zh/profile/Qingquan streams under the stones
————————————————
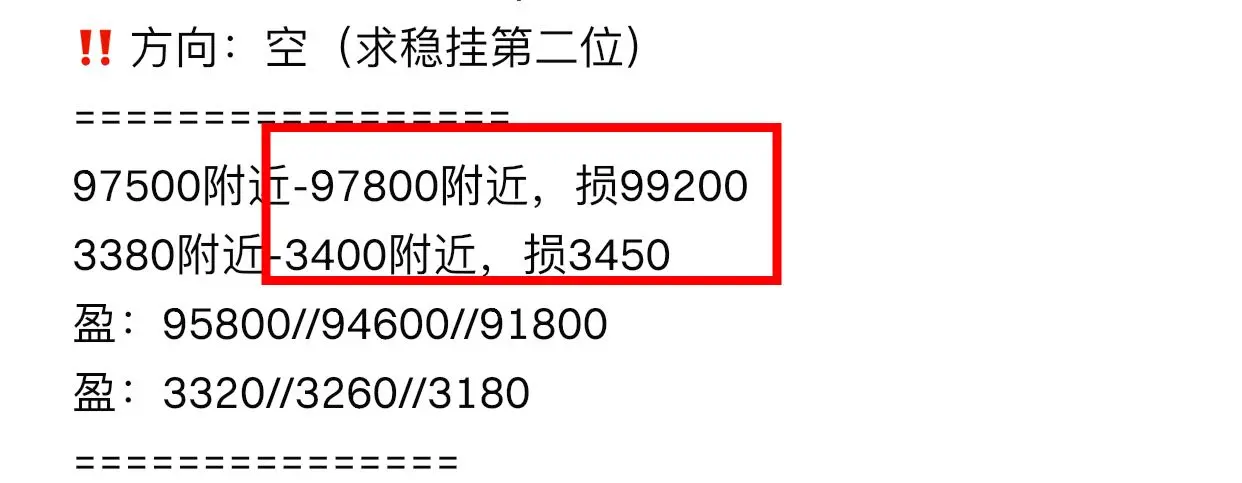
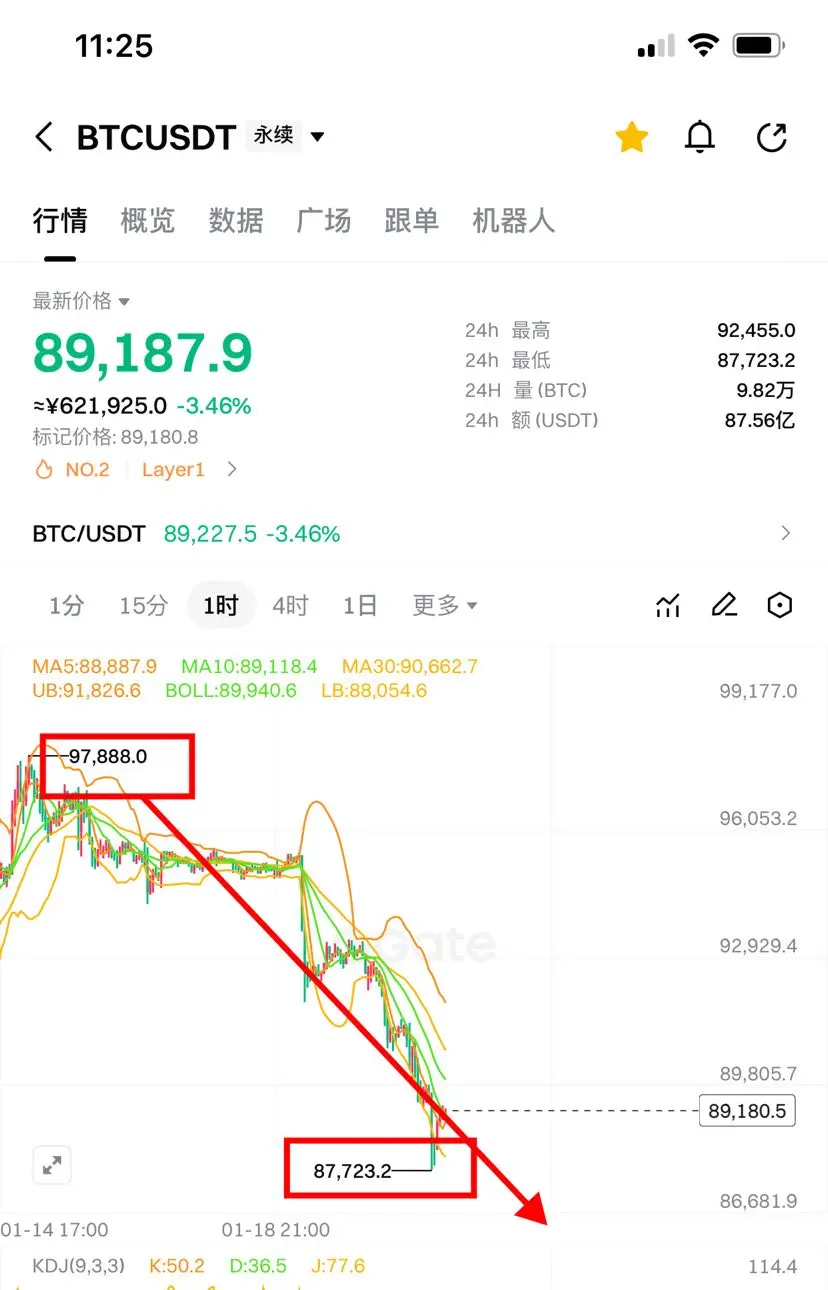
🔥 Last week 3065/90200+ 3060/89700 long-term longs, 3400/97800 pressure level take profit for big gains🀄️
🔥 Last week late 3400/97800 reversed to short, cur
View Originalhttps://www.gate.com/zh/profile/Qingquan streams under the stones
————————————————
🔥 Last week 3065/90200+ 3060/89700 long-term longs, 3400/97800 pressure level take profit for big gains🀄️
🔥 Last week late 3400/97800 reversed to short, cur

- Reward
- 10
- 10
- Repost
- Share
KeepUpWithTheRhythmOfTheTimes :
:
Hold on tight, we're about to take off 🛫View More
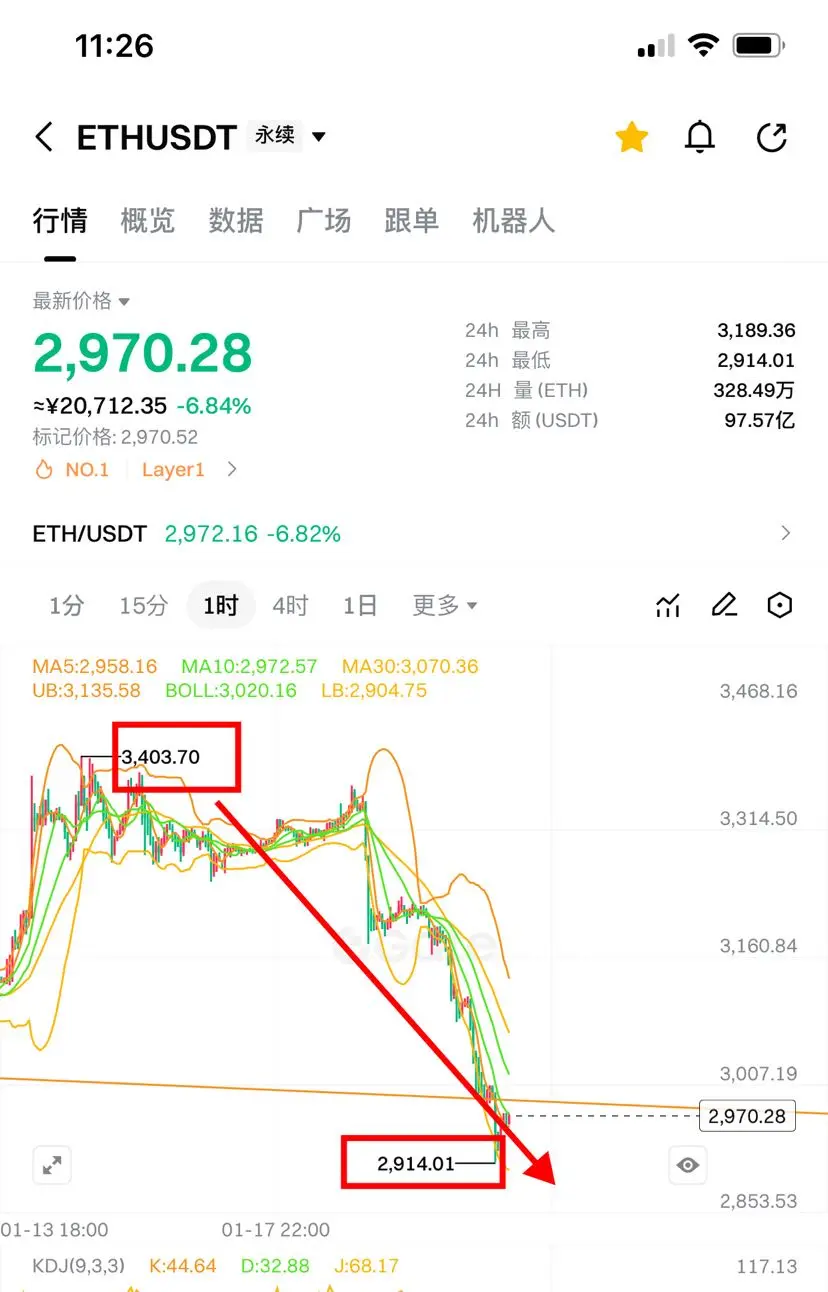
‼️ Guan He Ping Wheel Brothers, give me a thumbs up‼️ The 21st contract/spot order has been updated 👇 In the crypto world, we only follow the right people. Thank you all for your support. The New Year 3.5gt half-price promotion has already surpassed 140 people, and the last person to fully recover 7gt‼️ Apple click 👇
https://www.gate.com/zh/profile/ Little Ghost Daily Contract
🔥 Recently consumed over 2 million U‼️ Last week 3060/89700+3070/90300+3400/97800, big gains with 500,000 🀄️ Counter 3400/97800, shorting the spot at 2915/87800, big gains #现货黄金再创新高
View Originalhttps://www.gate.com/zh/profile/ Little Ghost Daily Contract
🔥 Recently consumed over 2 million U‼️ Last week 3060/89700+3070/90300+3400/97800, big gains with 500,000 🀄️ Counter 3400/97800, shorting the spot at 2915/87800, big gains #现货黄金再创新高

- Reward
- 10
- 10
- Repost
- Share
BigBigBigBigBigBubbleGum :
:
Hold on tight, we're about to take off 🛫View More
Load More
Join 40M users in our growing community
⚡️ Join 40M users in the crypto craze discussion
💬 Engage with your favorite top creators
👍 See what interests you
Trending Topics
57.26K Popularity
37.01K Popularity
21.57K Popularity
66.5K Popularity
347.42K Popularity
12.35K Popularity
10.77K Popularity
19.94K Popularity
109.12K Popularity
24.52K Popularity
219.38K Popularity
21.08K Popularity
6.93K Popularity
16.64K Popularity
173.43K Popularity
News
View MoreHe Yi: Overly taking things out of context and misinterpretation are hard to prevent, and rumors, hatred, and conspiracy theories are more likely to sweep through public sentiment.
1 m
Russell 2000 Index rises 1.2%, reaching a new all-time high
18 m
CNN: No written agreement has been reached on the Greenland issue
19 m
Spot platinum rises 3% intraday, hitting a historic high of $2558.20 per ounce
20 m
Ondo: Will launch BitGo tokenized stocks on chains like Solana
23 m
Pin