Why Comparing Today’s BTC to 2022 Is Absolutely Unprofessional
Recently, some analysts have been comparing the current BTC price moves to those of 2022.
Yes, short-term price patterns might look somewhat similar.
But when you look at the long-term picture, the comparison is completely absurd.
From
- the long-term price pattern
- the macroeconomic background
- the investor composition and supply/holding structure
the underlying logic is fundamentally different.
In analyzing and trading financial markets, the BIGGEST mistake is solely focusing on short-term, surface-level statistical similarities while ignoring long-term, macro, and fundamental drivers.
Completely Opposite Macro Background
In March 2022, the U.S. was firmly in a high-inflation, rate-hiking cycle driven by:
- excessive liquidity during COVID
- triggered by the Ukraine war, which pushed inflation more violently
Risk-free rates were rising, liquidity was being systematically withdrawn, and financial conditions were tightening.
In that environment, capital’s primary objective was risk avoidance.
What we saw in BTC was essentially a high-level distribution structure during a tightening cycle.
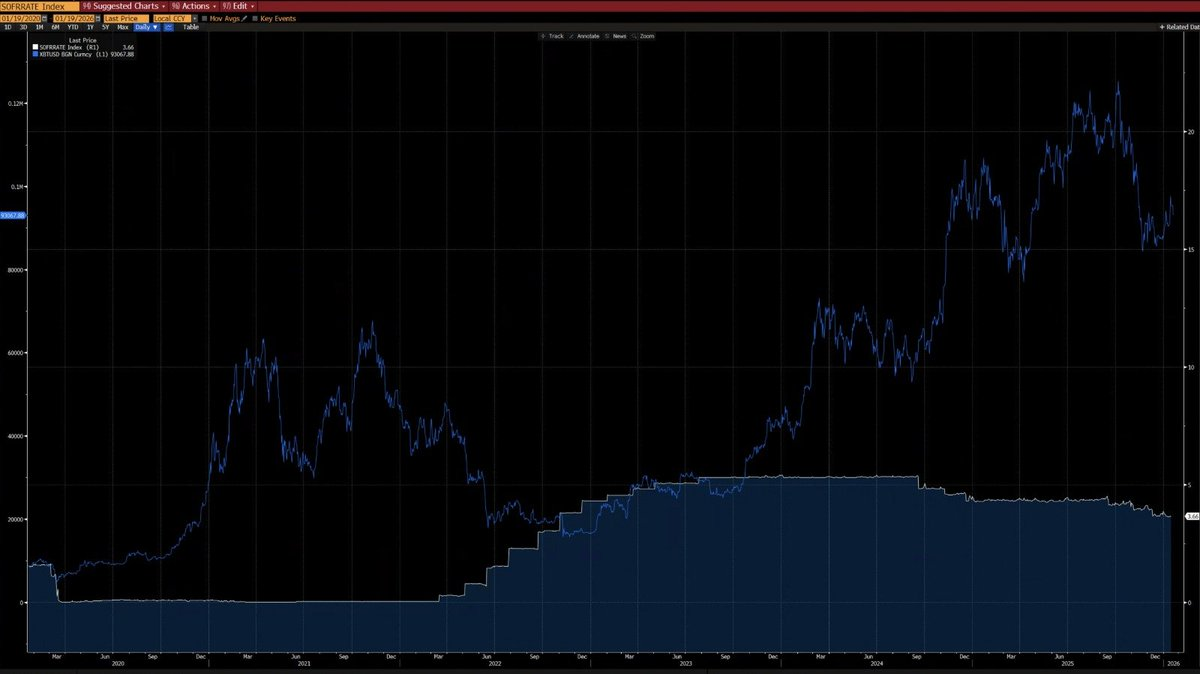
Currently, the macro environment is the opposite:
- The Ukraine conflict is de-escalating (partly due to the U.S. efforts to reduce inflation and lower interest rates),
- CPI and U.S. risk-free rates are decreasing,
- More importantly, the AI technology revolution has greatly strengthened the likelihood that the economy will enter a long-term disinflationary cycle. Therefore, on a larger cycle, interest rates have already entered a rate-cutting phase,
- Central bank liquidity is being re-injected into the financial system,
- This defines the capital behavior as risk-on.
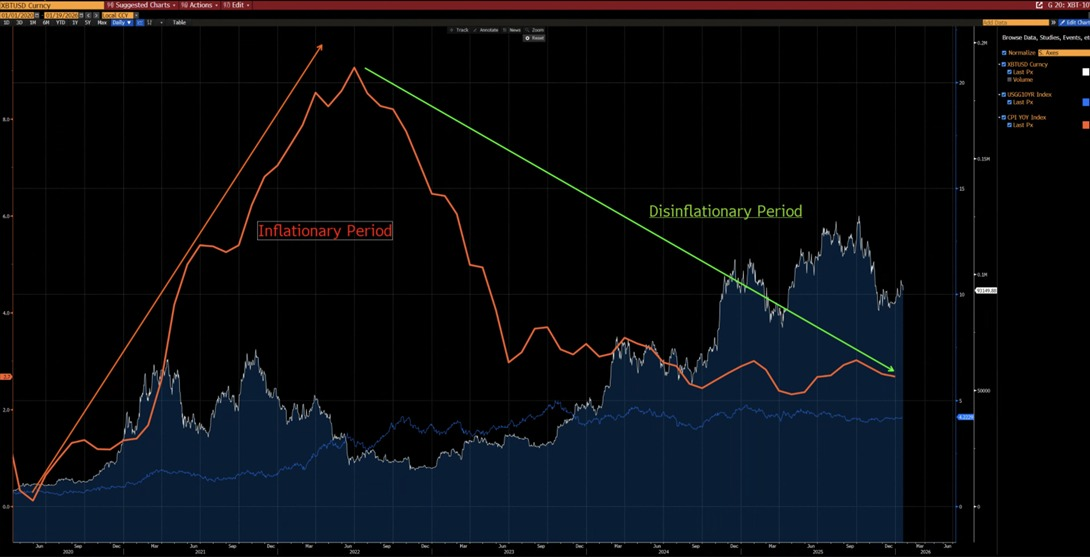
From the chart below, we can see that since 2020, BTC and CPI YoY changes have exhibited a clear negative correlation — BTC tends to decline during rising inflation cycles and rally during disinflationary cycles.
Under the AI-driven technological revolution, long-term disinflation is a high-probability outcome — a view also echoed by Elon Musk, which reinforces our thesis.
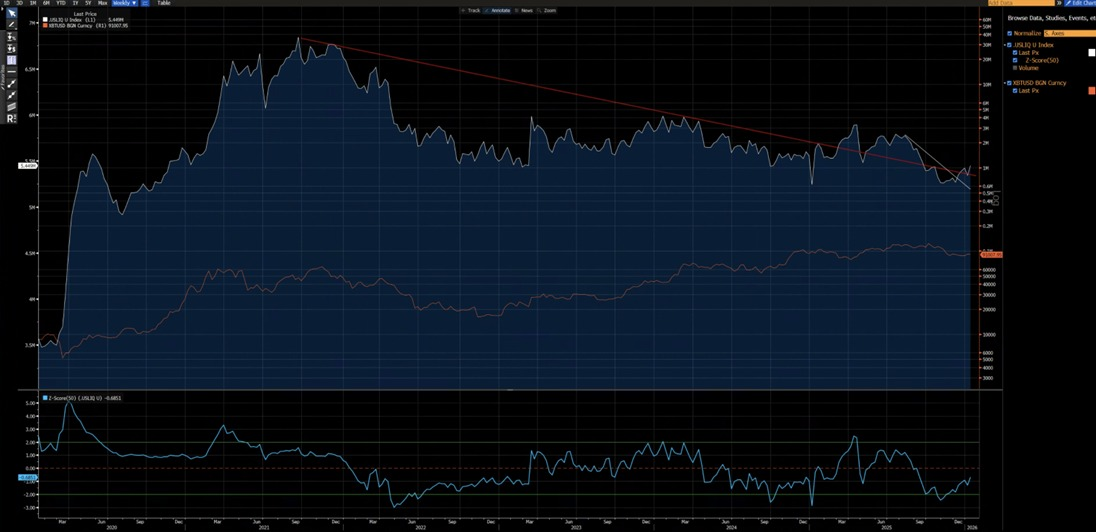
From the chart below, we can see that since 2020, BTC has shown a strong correlation with the U.S. liquidity index (except for distortions in 2024 caused by ETF inflows). At present, the U.S. liquidity index has broken above both its short-term (white) and long-term (red) downward trendlines — a NEW UPtrend is in sight.
Different Technical Structures
2021–2022:
- A weekly M-top structure, typically associated with long-cycle market tops that suppress price for extended periods.
2025:
- A weekly break below an ascending channel. From a probabilistic perspective, this is more likely a bear trap before a rebound back into the channel.
Yes, it cannot be fully ruled out that this becomes a 2022-style bearish continuation.
However, it’s critical to note that the 80,850 / 62,000 zone experienced extensive consolidation and rotation.
That prior absorption provides a far superior risk–reward profile for bullish positioning:
upside potential meaningfully exceeds downside risk.
What Would Be Required to Recreate a 2022-Style Bear Market?
Several non-negotiable conditions would have to be met:
- A renewed inflation shock or a major geopolitical crisis similar in scale to 2022,
- Central banks resuming rate hikes or balance sheet QT,
- A decisive and sustained breakdown below 80,850.
Until these conditions are satisfied, calling for a structural bear market is premature and speculative, not analytical.
Recently, some analysts have been comparing the current BTC price moves to those of 2022.
Yes, short-term price patterns might look somewhat similar.
But when you look at the long-term picture, the comparison is completely absurd.
From
- the long-term price pattern
- the macroeconomic background
- the investor composition and supply/holding structure
the underlying logic is fundamentally different.
In analyzing and trading financial markets, the BIGGEST mistake is solely focusing on short-term, surface-level statistical similarities while ignoring long-term, macro, and fundamental drivers.
Completely Opposite Macro Background
In March 2022, the U.S. was firmly in a high-inflation, rate-hiking cycle driven by:
- excessive liquidity during COVID
- triggered by the Ukraine war, which pushed inflation more violently
Risk-free rates were rising, liquidity was being systematically withdrawn, and financial conditions were tightening.
In that environment, capital’s primary objective was risk avoidance.
What we saw in BTC was essentially a high-level distribution structure during a tightening cycle.
Currently, the macro environment is the opposite:
- The Ukraine conflict is de-escalating (partly due to the U.S. efforts to reduce inflation and lower interest rates),
- CPI and U.S. risk-free rates are decreasing,
- More importantly, the AI technology revolution has greatly strengthened the likelihood that the economy will enter a long-term disinflationary cycle. Therefore, on a larger cycle, interest rates have already entered a rate-cutting phase,
- Central bank liquidity is being re-injected into the financial system,
- This defines the capital behavior as risk-on.
From the chart below, we can see that since 2020, BTC and CPI YoY changes have exhibited a clear negative correlation — BTC tends to decline during rising inflation cycles and rally during disinflationary cycles.
Under the AI-driven technological revolution, long-term disinflation is a high-probability outcome — a view also echoed by Elon Musk, which reinforces our thesis.
From the chart below, we can see that since 2020, BTC has shown a strong correlation with the U.S. liquidity index (except for distortions in 2024 caused by ETF inflows). At present, the U.S. liquidity index has broken above both its short-term (white) and long-term (red) downward trendlines — a NEW UPtrend is in sight.
Different Technical Structures
2021–2022:
- A weekly M-top structure, typically associated with long-cycle market tops that suppress price for extended periods.
2025:
- A weekly break below an ascending channel. From a probabilistic perspective, this is more likely a bear trap before a rebound back into the channel.
Yes, it cannot be fully ruled out that this becomes a 2022-style bearish continuation.
However, it’s critical to note that the 80,850 / 62,000 zone experienced extensive consolidation and rotation.
That prior absorption provides a far superior risk–reward profile for bullish positioning:
upside potential meaningfully exceeds downside risk.
What Would Be Required to Recreate a 2022-Style Bear Market?
Several non-negotiable conditions would have to be met:
- A renewed inflation shock or a major geopolitical crisis similar in scale to 2022,
- Central banks resuming rate hikes or balance sheet QT,
- A decisive and sustained breakdown below 80,850.
Until these conditions are satisfied, calling for a structural bear market is premature and speculative, not analytical.
Different Investor Structure
2020–2022:
- Retail-dominated market, limited institutional participation, especially from long-term allocators.
From 2023 onward:
- The launch of BTC ETFs introduced structural long-term holders, effectively locking up supply, sharply reducing trading velocity, and materially lowering volatility.
2023 marked a structural inflection point for BTC as an asset, both macroeconomically and quantitatively.
BTC’s volatility regime shifted from:
80–150% historically
- to
- 30–60%, a fundamentally different asset behavior.
Core Structural Difference (Now vs. 2022)
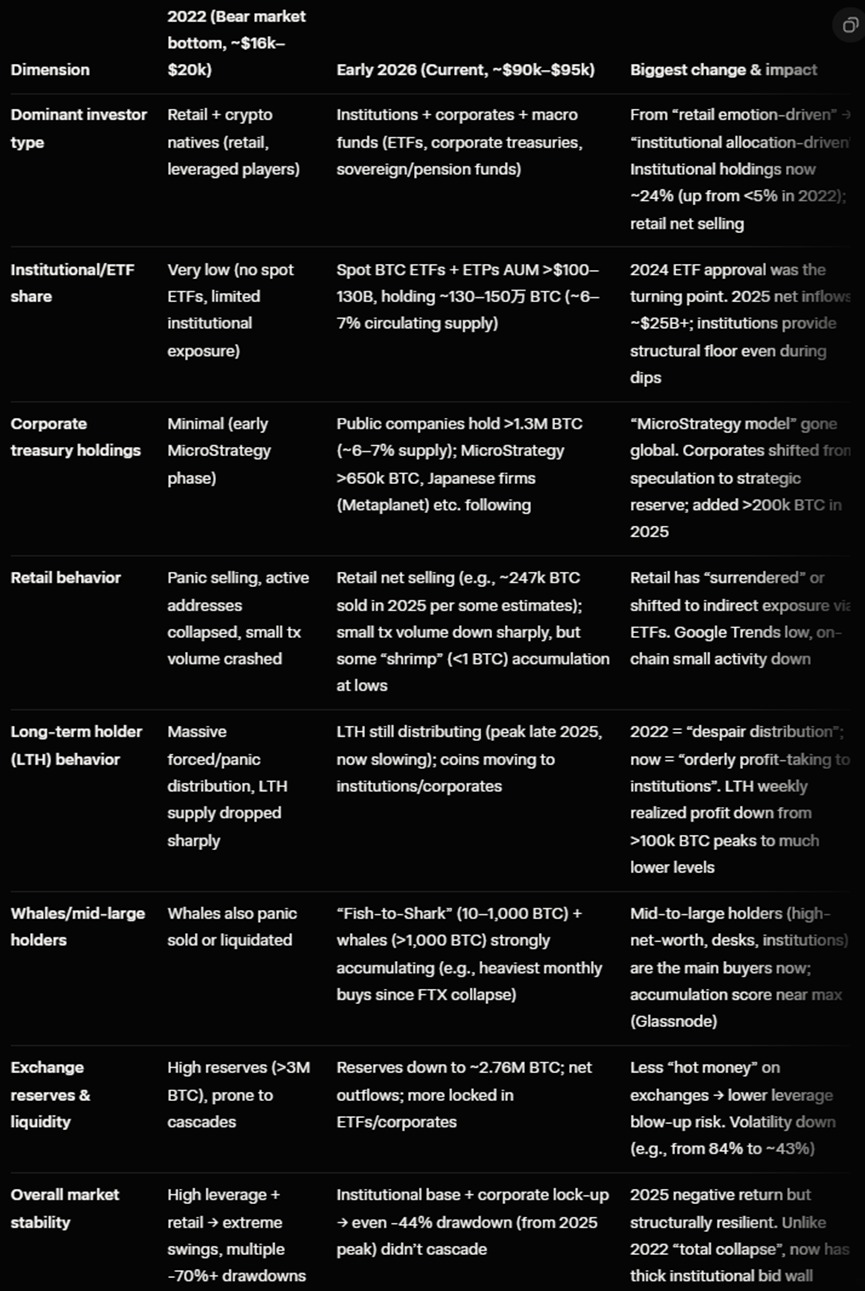
The biggest difference in BTC investor structure between now (early 2026) and 2022 is the shift from:
retail-dominated, high-leverage speculation
→ institution-dominated, structurally long-term holding.
In 2022, BTC experienced a classic “crypto-native bear market” driven by retail panic selling and cascading leveraged liquidations.
Today, BTC operates in a far more mature institutional era, characterized by:
- stable underlying demand,
- locked supply,
- and institutional-grade volatility.
Here’s a core comparison by Grok based on on-chain data (e.g., Glassnode, Chainalysis) and institutional reports (e.g., Grayscale, Bitwise, State Street) as of mid-January 2026 (BTC ~$90k–$95k range):
Different Investor Structure
2020–2022:
- Retail-dominated market, limited institutional participation, especially from long-term allocators.
From 2023 onward:
- The launch of BTC ETFs introduced structural long-term holders, effectively locking up supply, sharply reducing trading velocity, and materially lowering volatility.
2023 marked a structural inflection point for BTC as an asset, both macroeconomically and quantitatively.
BTC’s volatility regime shifted from:
80–150% historically
- to
- 30–60%, a fundamentally different asset behavior.
Core Structural Difference (Now vs. 2022)
The biggest difference in BTC investor structure between now (early 2026) and 2022 is the shift from:
retail-dominated, high-leverage speculation
→ institution-dominated, structurally long-term holding.
In 2022, BTC experienced a classic “crypto-native bear market” driven by retail panic selling and cascading leveraged liquidations.
Today, BTC operates in a far more mature institutional era, characterized by:
- stable underlying demand,
- locked supply,
- and institutional-grade volatility.
Here’s a core comparison by Grok based on on-chain data (e.g., Glassnode, Chainalysis) and institutional reports (e.g., Grayscale, Bitwise, State Street) as of mid-January 2026 (BTC ~$90k–$95k range):
Disclaimer:
- This article is reprinted from [GarrettBullish]. All copyrights belong to the original author [GarrettBullish]. If there are objections to this reprint, please contact the Gate Learn team, and they will handle it promptly.
- Liability Disclaimer: The views and opinions expressed in this article are solely those of the author and do not constitute any investment advice.
- Translations of the article into other languages are done by the Gate Learn team. Unless mentioned, copying, distributing, or plagiarizing the translated articles is prohibited.
Share
Content
Completely Opposite Macro Background
Different Technical Structures
What Would Be Required to Recreate a 2022-Style Bear Market?
Completely Opposite Macro Background
Different Technical Structures
What Would Be Required to Recreate a 2022-Style Bear Market?
Different Investor Structure
Different Investor Structure


Related Articles

In-depth Explanation of Yala: Building a Modular DeFi Yield Aggregator with $YU Stablecoin as a Medium

BTC and Projects in The BRC-20 Ecosystem

What Is a Cold Wallet?

Blockchain Profitability & Issuance - Does It Matter?
What is the Altcoin Season Index?