2026 NOS Price Prediction: Expert Analysis and Market Forecast for the Coming Year
Introduction: NOS Market Position and Investment Value
Nosana (NOS), positioned as a decentralized CPU-based computing platform revolutionizing development operations for blockchain projects, has been serving the crypto ecosystem since its launch in 2022. As of 2026, NOS maintains a market capitalization of approximately $22.53 million, with a circulating supply of around 83.4 million tokens, and the price hovering around $0.2702. This asset, recognized as an innovative solution for democratizing cloud computing power, is playing an increasingly vital role in connecting blockchain developers to global computing resources.
This article will comprehensively analyze NOS price movements from 2026 to 2031, combining historical patterns, market supply-demand dynamics, ecosystem development, and macroeconomic conditions to provide investors with professional price forecasts and practical investment strategies.
I. NOS Price History Review and Market Status
NOS Historical Price Evolution Trajectory
- 2022: Token launch in January with an initial offering price of $0.03, marking the entry of Nosana into the decentralized computing market
- 2023: Price experienced significant volatility, reaching a historical low of $0.01046656 in October, reflecting broader market correction pressures
- 2024: Notable recovery momentum emerged, with price climbing to a peak of $7.83 in March, representing substantial appreciation from previous lows
- 2024-2025: Price underwent consolidation and adjustment phases following the March peak
NOS Current Market Situation
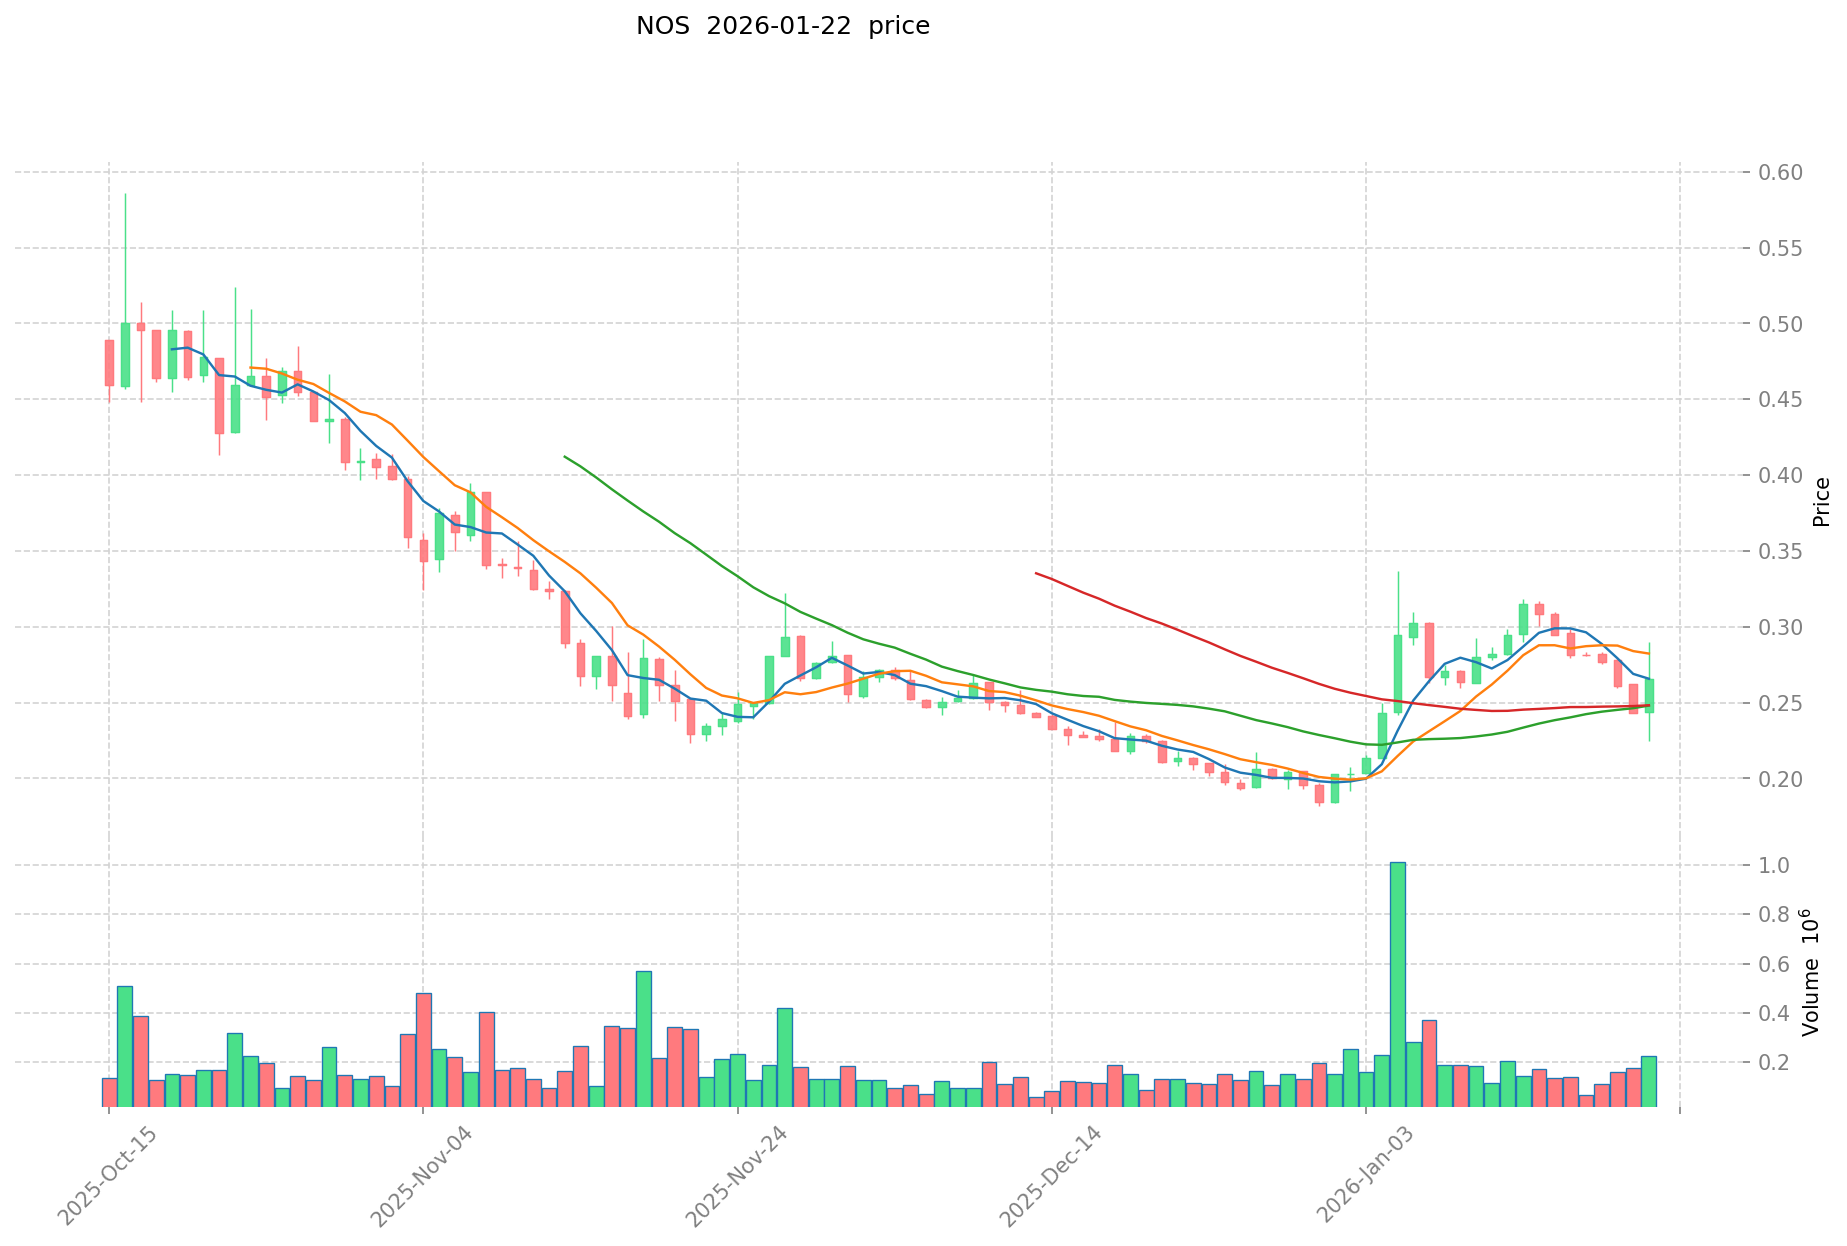
As of January 22, 2026, NOS is trading at $0.2702, showing a 24-hour increase of 18.37%. The token has demonstrated mixed performance across different timeframes, with a 0.3% gain over the past hour and a 27.43% increase over the past 30 days. However, the 7-day performance shows an 11.77% decline, and the one-year metric indicates an 89.99% decrease from previous levels.
The 24-hour trading range spans from $0.2244 to $0.2901, with total trading volume reaching $68,070.82. The current market capitalization stands at approximately $22.53 million, with a circulating supply of 83.4 million NOS tokens out of a total supply of 100 million tokens. The market cap to fully diluted valuation ratio is 83.4%, and NOS holds a 0.00084% share of the total cryptocurrency market.
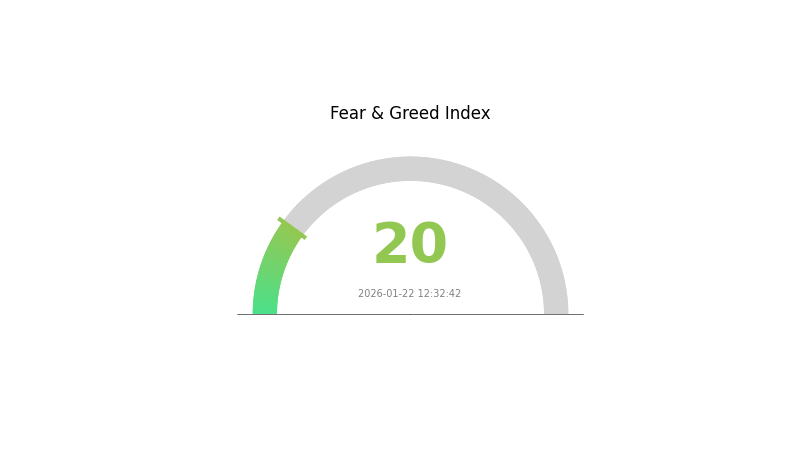
The token maintains a ranking of 826 in the cryptocurrency market, with holder count at 47,419. NOS is listed on 8 exchanges and is actively traded on Gate.com. The current market sentiment indicator shows a fear level of 20, categorized as "Extreme Fear," suggesting cautious market conditions.
Click to view current NOS market price
NOS Market Sentiment Index
2026-01-22 Fear and Greed Index: 20 (Extreme Fear)
Click to view current Fear & Greed Index
The cryptocurrency market is currently experiencing extreme fear, with the Fear and Greed Index hitting 20. This level indicates significant pessimism among investors, reflecting widespread concern about market volatility and potential downside risks. Such extreme fear conditions often present contrarian opportunities for long-term investors, as panic selling can create attractive entry points. However, caution remains advisable as market uncertainty persists. Traders should monitor market developments closely and manage risk appropriately during this period of heightened market anxiety.
NOS Holding Distribution
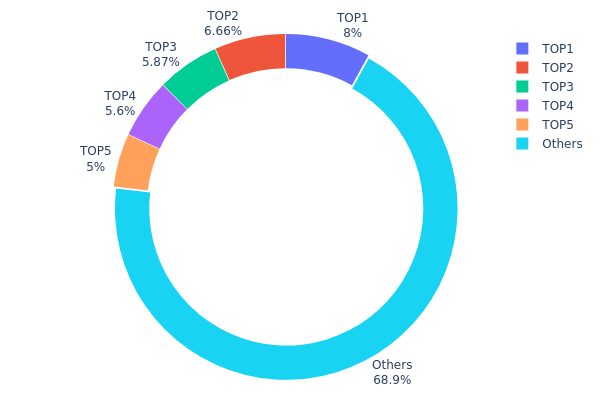
The holding distribution chart illustrates the percentage allocation of NOS tokens across different wallet addresses, providing insight into the degree of decentralization and potential concentration risk within the token's ecosystem. This metric serves as a critical indicator of market structure stability and the potential for price manipulation.
Based on the current data, NOS exhibits a moderate level of concentration among top holders. The largest address controls 8.00% of the total supply (8,000K tokens), followed by the second and third largest addresses holding 6.65% (6,657.90K) and 5.87% (5,871.95K) respectively. The top five addresses collectively account for 31.12% of total circulation, while the remaining 68.88% is distributed among other addresses. This distribution pattern suggests a relatively balanced structure, where no single entity possesses overwhelming control over the token supply.
From a market dynamics perspective, this distribution profile indicates a healthy level of decentralization that mitigates extreme concentration risks. The absence of any single address holding more than 10% of supply reduces the likelihood of coordinated market manipulation or massive sell-offs that could trigger sharp price volatility. The substantial 68.88% held by numerous smaller addresses reflects broad community participation and suggests a more resilient on-chain structure. However, investors should remain cognizant that the top five addresses still maintain meaningful influence, warranting continuous monitoring of their transaction activities to assess potential market impact.
Click to view current NOS Holding Distribution
| Top | Address | Holding Qty | Holding (%) |
|---|---|---|---|
| 1 | nosTxp...g28g54 | 8000.00K | 8.00% |
| 2 | 9u39MP...wPpZAr | 6657.90K | 6.65% |
| 3 | nosMFV...bqpmjG | 5871.95K | 5.87% |
| 4 | nosL7e...qkWa8h | 5600.00K | 5.60% |
| 5 | nosCcR...TLmvXd | 5000.00K | 5.00% |
| - | Others | 68869.96K | 68.88% |
II. Core Factors Influencing NOS Future Price
Based on the available information, there is insufficient data to provide a comprehensive analysis of the core factors affecting NOS price movements. The provided materials do not contain specific details regarding supply mechanisms, institutional dynamics, macroeconomic correlations, or technical developments for this asset.
To conduct a thorough price factor analysis, additional research would be needed covering:
- Token economics and supply schedule details
- Institutional adoption patterns and wallet concentration metrics
- Historical price correlation with broader market conditions
- Development roadmap and ecosystem growth indicators
Investors interested in NOS should conduct independent research through official project channels and verified data sources before making investment decisions.
III. NOS Price Forecast for 2026-2031
2026 Outlook
- Conservative forecast: $0.1573 - $0.2712
- Neutral forecast: $0.2712
- Optimistic forecast: $0.34985 (requires favorable market conditions and increased adoption)
Mid-term Outlook (2027-2029)
- Market stage expectations: The token is anticipated to enter a gradual growth phase, with steady price appreciation driven by ecosystem development and broader market recovery.
- Price range forecasts:
- 2027: $0.22358 - $0.43784 (approximately 14% increase from 2026)
- 2028: $0.2956 - $0.5014 (approximately 38% increase from 2026)
- 2029: $0.3371 - $0.63042 (approximately 62% increase from 2026)
- Key catalysts: Enhanced platform utility, strategic partnerships, and improved market sentiment in the cryptocurrency sector could serve as primary drivers for price growth during this period.
Long-term Outlook (2030-2031)
- Base scenario: $0.30444 - $0.78514 by 2030 (assuming sustained ecosystem development and stable market conditions)
- Optimistic scenario: $0.59366 - $0.83772 by 2031 (approximately 144% increase from 2026, contingent upon significant adoption milestones and favorable regulatory environment)
- Transformative scenario: Prices could potentially exceed $0.83772 (requires exceptional market conditions, widespread institutional adoption, and major technological breakthroughs)
| Year | Predicted High Price | Predicted Average Price | Predicted Low Price | Price Change |
|---|---|---|---|---|
| 2026 | 0.34985 | 0.2712 | 0.1573 | 0 |
| 2027 | 0.43784 | 0.31052 | 0.22358 | 14 |
| 2028 | 0.5014 | 0.37418 | 0.2956 | 38 |
| 2029 | 0.63042 | 0.43779 | 0.3371 | 62 |
| 2030 | 0.78514 | 0.53411 | 0.30444 | 97 |
| 2031 | 0.83772 | 0.65962 | 0.59366 | 144 |
IV. NOS Professional Investment Strategies and Risk Management
NOS Investment Methodology
(1) Long-term Holding Strategy
- Suitable for: Investors who believe in decentralized computing infrastructure and have moderate to high risk tolerance
- Operational recommendations:
- Consider accumulating positions during market corrections when the price approaches key support levels
- Monitor the development progress of Nosana's CI/CD infrastructure and adoption metrics
- Use Gate Web3 Wallet for secure storage of NOS tokens with private key control
(2) Active Trading Strategy
- Technical analysis tools:
- Moving averages: Monitor the 50-day and 200-day moving averages to identify trend changes; NOS has shown high volatility with 18.37% daily fluctuation
- Volume analysis: Track the daily trading volume of approximately $68,070 to confirm breakout authenticity
- Swing trading essentials:
- Set stop-loss orders given the token's historical volatility range between $0.01046656 and $7.83
- Consider the 24-hour price range ($0.2244 to $0.2901) when planning entry and exit points
NOS Risk Management Framework
(1) Asset Allocation Principles
- Conservative investors: 1-3% of crypto portfolio
- Aggressive investors: 5-10% of crypto portfolio
- Professional investors: May allocate up to 15% based on comprehensive research and market conditions
(2) Risk Hedging Solutions
- Portfolio diversification: Combine NOS holdings with more established cryptocurrencies to balance risk exposure
- Position sizing: Use dollar-cost averaging to mitigate timing risk in this volatile asset
(3) Secure Storage Solutions
- Recommended wallet: Gate Web3 Wallet offers secure storage with user-controlled private keys for NOS tokens on Solana
- Cold storage option: Consider hardware wallet solutions for long-term holdings exceeding $1,000
- Security precautions: Never share private keys, enable two-factor authentication, and verify contract addresses (nosXBVoaCTtYdLvKY6Csb4AC8JCdQKKAaWYtx2ZMoo7) before transactions
V. NOS Potential Risks and Challenges
NOS Market Risks
- High volatility: NOS experienced an 89.99% decline over one year, indicating substantial price instability
- Limited liquidity: With a daily trading volume of approximately $68,070, large orders may face slippage challenges
- Market cap concentration: Ranking at #826 with 0.00084% market dominance suggests vulnerability to broader market sentiment shifts
NOS Regulatory Risks
- Decentralized computing services may face evolving regulatory scrutiny as authorities clarify frameworks for blockchain-based infrastructure
- Token classification uncertainty could impact trading availability and compliance requirements across different jurisdictions
- Cross-border service provision may encounter varying legal interpretations of decentralized CPU rental models
NOS Technical Risks
- Network dependency: Operating on Solana blockchain exposes NOS to potential network congestion or technical issues affecting the underlying infrastructure
- Competition risk: The decentralized computing sector faces competition from established cloud providers and emerging blockchain-based alternatives
- Adoption challenges: Success depends on widespread adoption of CI/CD infrastructure services by blockchain developers
VI. Conclusion and Action Recommendations
NOS Investment Value Assessment
Nosana presents an innovative approach to decentralized computing infrastructure with a focus on CI/CD services for blockchain developers. The project's vision of democratizing CPU cloud computing addresses a genuine market need. However, the token has experienced significant volatility, declining 89.99% over the past year while showing recent positive momentum with an 18.37% daily increase and 27.43% monthly gain. With 83.4% of tokens in circulation and a modest market cap of approximately $22.5 million, NOS carries substantial risk alongside its potential in the growing decentralized infrastructure sector.
NOS Investment Recommendations
✅ Beginners: Consider observing from the sidelines until gaining deeper understanding of decentralized computing markets; if participating, limit exposure to no more than 1-2% of total crypto portfolio
✅ Experienced investors: May consider small allocation (3-5%) as a speculative position in decentralized infrastructure, implementing strict stop-loss measures given historical volatility
✅ Institutional investors: Conduct thorough due diligence on Nosana's technical roadmap and competitive positioning before considering strategic allocation as part of a diversified blockchain infrastructure thesis
NOS Trading Participation Methods
- Spot trading: Purchase NOS tokens directly on Gate.com with various trading pairs for flexible entry and exit
- Dollar-cost averaging: Implement systematic purchasing at regular intervals to smooth out volatility effects
- Portfolio integration: Include NOS as part of a broader decentralized infrastructure allocation alongside complementary projects
Cryptocurrency investment carries extreme risk, and this article does not constitute investment advice. Investors should make prudent decisions based on their own risk tolerance and are advised to consult professional financial advisors. Never invest more than you can afford to lose.
FAQ
What is the historical price trend of NOS coin?
NOS has experienced significant volatility since its launch. The token peaked during bull market cycles and saw corrections during market downturns. Overall, NOS demonstrates growth potential with increasing adoption and network expansion driving long-term upward trajectory in the cryptocurrency market.
What are the main factors affecting NOS price?
NOS price is influenced by market demand, trading volume, network development progress, ecosystem expansion, investor sentiment, and overall crypto market trends. These factors collectively determine price movements in the market.
What price predictions do experts have for NOS in the future?
Experts anticipate NOS could experience significant growth driven by increasing adoption in decentralized networks and expanding ecosystem utility. As demand strengthens and network effects multiply, many analysts forecast potential substantial appreciation over the coming years, though market dynamics remain subject to broader crypto market conditions.
How to conduct technical analysis of NOS price?
Analyze NOS price through key metrics: support and resistance levels, moving averages (MA50, MA200), RSI oscillator, and trading volume trends. Monitor MACD signals and candlestick patterns for trend confirmation. Track on-chain metrics and market sentiment indicators for comprehensive technical evaluation.
What are NOS's price advantages compared to similar projects?
NOS offers competitive pricing through lower entry barriers and reduced token supply compared to peers, enabling better price appreciation potential. Strong community support and growing transaction volume drive sustainable value growth.
What are the risk factors for NOS price prediction?
NOS price prediction risks include market volatility, regulatory changes, trading volume fluctuations, technology developments, and macroeconomic factors. Cryptocurrency markets are highly unpredictable, influenced by sentiment shifts, adoption rates, and competitive landscape changes.
Share
Content
Introduction: NOS Market Position and Investment Value
I. NOS Price History Review and Market Status
II. Core Factors Influencing NOS Future Price
III. NOS Price Forecast for 2026-2031
IV. NOS Professional Investment Strategies and Risk Management
V. NOS Potential Risks and Challenges
VI. Conclusion and Action Recommendations
FAQ
How to Buy Cryptocurrency


Trending Cryptocurrencies


2025 SUI coin: price, buying guide, and Staking rewards

How to Buy Crypto: A Step-by-Step Guide with Gate.com

HNT Price in 2025: Helium Network Token Value and Market Analysis
What is SwissCheese (SWCH) and How Does It Democratize Investment?

Cardano (ADA) Price Analysis and Outlook for 2025
How to Invest in Metaverse Crypto
Why Is Crypto Down? Market Analysis and Key Factors

What is BNKR: A Comprehensive Guide to Understanding the Decentralized Banking Revolution

What is C98: A Comprehensive Guide to Understanding This Digital Asset and Its Role in the Crypto Market

What is ABT: A Comprehensive Guide to Activity-Based Therapy and Its Applications in Modern Healthcare

What is BENQI: A Complete Guide to the Avalanche Lending Protocol and Its DeFi Opportunities